Gwern.net Website Traffic
Meta page describing Gwern.net editing activity, traffic statistics, and referrer details, primarily sourced from Google Analytics (2011-present).
On a semi-annual basis, since 201115ya, I review Gwern.net website traffic using Google Analytics; although what most readers value is not what I value, I find it motivating to see total traffic statistics reminding me of readers (writing can be a lonely and abstract endeavour), and useful to see what are major referrers.
Gwern.net typically enjoys steady traffic in the 50–100k range per month, with occasional spikes from social media, particularly Hacker News; over the first decade (2010–102020), there were 7.98m pageviews by 3.8m unique users.
For background about the goals, tools, design, and implementation of Gwern.net, see the page About This Website.
2023
January 2023–July 2023
Though they [philosophers] write contemptu gloriæ, yet as Hieron observes, they will put their names to their books.
Activity graph for this period (2023-01-02–2023-07-01)

Plot of patch creations (y-axis) versus date (x-axis): January 2023–July 2023
Analytics traffic records 466,128 page-views by 232,703 unique visitors over the 181 days, or 2,575 page-views per day for an increase of +232 page-views a day compared to the previous 6 months.
(Lifetime total: 13,268,506 page-views by 5,906,937 unique visitors.)

Plot of page-views (y-axis) versus date (x-axis), early 2023
homepage: 77,010
Open Questions: 19,092
Clippy: 14,992
GPT-3: 14,713
About: 14,473
Links/Me: 14,054:
Scaling Hypothesis: 12,672
Feynman’s Maze Story: 11,312
Danbooru2021: 9,717
Spaced Repetition: 9,179
For 2023, I made some long-overdue changes in moving the website domain name to the shorter gwern.net, and scrapping the old image/ subdirectory; both of these were increasingly atavistic and getting in the way.
Another change—perhaps just as overdue, and equally painful in its own way—was the change of the site theme from the old 3-column layout to a more contemporary header+1-column layout, which makes it easier to lay out margin notes & sidenotes, and makes the desktop version look more like the mobile version.
Referrals:
Twitter: 23,445
HN: 20,888
TWDNE: 8,484
Reddit: 6,254
LW: 3,389
Github: 3,161
ACX: 2,635
Habr.com: 773
Towards Data Science: 719
Bored Humans: 692
Newsletter: ~11,720 subscribers.
2022
July 2022–January 2023
…That farther, if men shall our vertues tell,
We haue more mouthes, but not more merit won;
It doth not greater make that which is laudable,
The flame is bigger blowne, the fire all one.And for the few that onely lend their eare,
That few, is all the world; which with a few
Doe euer liue, and moue, and worke, and stirre.
This is the heart doth feele, and onely know
The rest of all, that onely bodies beare,
Rowle vp and downe, and fill but vp the row.Samuel Daniel (Musophilus 1601425ya)
Activity graph for this period (2022-07-03–2023-01-01):

Plot of patch creations (y-axis) versus date (x-axis): July 2022–January 2023
Analytics traffic records 428,783 page-views by 226,193 unique visitors over the 183 days, or 2,343 page-views per day for a decrease of −354 page-views a day compared to the previous 6 months.
(Lifetime total: 12,797,276 page-views by 5,655,347 unique visitors.)

Plot of page-views (y-axis) versus date (x-axis), late 2022
homepage: 77,496
Danbooru2021: 23,907
GPT-3: 18,545
TWDNE: 16.740
About: 14,536
Spaced Repetition: 12,554
Links: 12,221
Faces: 11,167
Turing-complete: 10,785
Lizardman Constant: 10,203
Scaling Hypothesis: 8,750
Technical changes were mostly polish, aside from the addition of a powerful primitive: client-side dynamic/lazy transclusions—which allow for all sorts of design changes & refactoring.
Referrers:
HN: 17,177
TWDNE: 13,846
Reddit: 12,096
Twitter: 10,787
Github: 3,157
LW: 1,951
YT: 1,867
Milan Cvitkovic: 1,137
Jessime: 1,034
Bored Humans: 950
Smilegate.ai: 879
Newsletter: ~10,905 subscribers.
January 2022–July 2022
To be a well-favoured man is the gift of fortune; but to write and read comes by nature.
Shakespeare (Much Ado About Nothing, III § 3)
Activity graph for this period (2022-01-03–2022-07-02):

Plot of patch creations (y-axis) versus date (x-axis): January 2022–July 2022
Traffic: Early 2022
Analytics traffic records 488,337 page-views by 245,430 unique visitors over the 181 days, or 2,697 page-views per day for an increase of +30 page-views a day compared to the previous 6 months.
(Lifetime total: 12,368,765 page-views by 5,451,826 unique visitors.)

Plot of page-views (y-axis) versus date (x-axis), early 2022
homepage: 76,804
“It Looks Like You’re Trying To Take Over The World”: 24,352
Design: 20,883
TWDNE: 19,035
GPT-3: 18,935
About: 16,102
Scaling Hypothesis: 14,618
Links: 14,495
Faces: 14,063
Danbooru2021: 11,136
The tag system continued to be painstakingly refined for as fast and compact a reading experience as possible; it was working reasonably well as-is and I was unifying the old & new tag systems, but then a Hacker News submission of the design page forced us to accept, among other changes we made in response to the criticisms, that simply live-popping-up tag pages was not good enough (inherently too slow & bulky) and cross-page popups had to be completely revamped by scraping the abstracts & ToCs to create a sort of mini-page version of each page. (Ironically, bringing us back to version #3 or so of how popups worked—“time is a circle”! Especially in design.) This was infuriatingly hard to get working exactly right.
For the Clippy story, we implemented an ambitious ‘reader mode’, which creates an entire new modality on par with dark mode: it hides footnotes, links, metadata, and everything else which might be optional. This let us turn the Clippy story into an interesting two-stage reading experience—first as pure fiction, then heavily annotated with nonfiction references. Highly unusual, hairy JS, not useful on most pages, but rather interesting.
My Patreon profile was flat and down on net at ~$1,300/month.
Promotion: Early 2022
Referrals turnover:
HN: 35,692
TWDNE: 15,116
Twitter: 10,866
Reddit: 79,63
LW: 3,342
Github: 2,065
ACX: 1,269
FB: 1,264
Milan Cvitkovic: 1,174
My monthly mailing list has reached 10,041 subscribers, +811, despite still no issues (perfectionism); this is due to a few links by popular writers like Dominc Cummings & Substack’s new newsletter recommendation feature.
2021
July 2021–January 2022
Amusing notion: many things that I would not want to tell anyone, I tell the public; and for my most secret knowledge and thoughts I send my most faithful friends to a bookseller’s shop.
Activity graph for this period (2021-07-06–2022-01-03):

Plot of patch creations (y-axis) versus date (x-axis): July 2021–January 2022
Traffic: Late 2021
Analytics traffic records 485,524 page-views by 251,483 unique visitors over the 182 days, or 2,667 page-views per day for an increase of +365 page-views a day compared to the previous 6 months.
(Lifetime total: 11,904,007 page-views by 5,165,795 unique visitors.)

Plot of page-views (y-axis) versus date (x-axis), late 2021
Improvements: 37,467
TWDNE: 22,877
GPT-3: 22,464
Startup ideas: 18,171
Faces: 16,933
About: 15,991
Spaced repetition: 14,155
The Melancholy of Subculture Society: 14,122
Links: 13,582
Danbooru2020: 11,066
With popovers implemented, I turned my attention to revamping the documents directory system into a considerably more powerful tag system. First, I recreated the link-bibliography feature for each page, but at the directory level: directories can now be ‘browsed’, viewed as a long document with each file’s annotation transcluded (or just a bare link if that is all that is available). So one can scroll through all, say, AlphaStar-related documents. With these ‘directory indexes’ available as on-site pages, they can of course be popped up. Now, if there is a directory of documents on a specific topic which can be viewed as a list, and we can automatically link to this list from each member document, what is that? Why, it’s a ‘tag’, of course! So, directories are now considered to define nested tags; tags can be added to annotations of URLs, and so each annotation now defines a virtual file, which will be transcluded into the directory index as if it were a local file inside that directory. (For example, /doc/ai/nn/transformer/gpt/ is now the tag ai/gpt; it contains files such as Radford et al 2019, but it also ‘contains’ a wide variety of URLs or files in other directories whose annotations include the tag ai/gpt.)
This took a fair amount of iteration and fiddling with presentation and tooling, but the result is a fairly powerful tagging system which required next to no frontend JS/CSS changes, while remaining fully static. (This allows much more flexibility in organizing files since they no longer need to be in a single master winner-takes-all category, and it takes a lot of the burden off the pages which were just bibliographies, many of which could be turned into tags instead: instead of manually updating with entries, I can simply add the tag and it will auto-update.) With a ‘tag’ system implemented, I spent a lot of time setting up tags for topics I’ve noticed but have never written a page on (eg. the inverted U-curve of novelty preferences).
Other major features included ‘backlinks’ (reverse citations), and ‘similar links’ (generating neural net embeddings, via the OA GPT-3 API, of all annotations to find similar links, which can be used inline or browsed via yet another link that pops up). In addition, there was endless tweaking of rewrite rules, squashing various bugs, refactoring, writing little helper tools, etc., not worth going into any detail on but all time-consuming. So, not much writing done.
My Patreon profile was flat and down on net at $1,333/month.
Promotion: Late 2021
Referrals turnover:
HN: 35,324
Twitter: 17,766
TWDNE: 15,790
Reddit: 7,592
Alexander Kruel: 3,056
Facebook: 2,091
Astral Codex Ten (ACX; née SSC): 1,824
Github: 1,285
towardsdatascience.com: 1,279Gwern.net: 1,229
My monthly mailing list has reached 9,160 subscribers, +852 (compromised by not sending out any issues since June because busy writing annotations & revamping the backend as described above).
January 2021–July 2021
Myself when young did eagerly frequent
Doctor and Saint, and heard great argument
About it and about: but evermore
Came out by the same door where in I went.
Activity graph for this period (2021-01-04–2021-07-05):

Plot of patch creations (y-axis) versus date (x-axis): January 2021–July 2021
Traffic: Early 2021
Analytics traffic records 421,475 page-views by 217,231 unique visitors over the 183 days, or 2,303 page-views per day for an decrease of −1720306ya page-views a day compared to the previous 6 months. I am not sure why, it may be from removing analytics from hosted HTML files.
(Lifetime total: 11,431,842 page-views by 4,948,125 unique visitors.)

Plot of page-views (y-axis) versus date (x-axis), early 2021
GPT-3 Creative Fiction: 35,309
Faces: 24,395 (due to writeup of This Anime Does Not Exist.ai)
TWDNE: 19,188
Internet Search Tips: 18,141
About: 16,688
Links: 15,021
Spaced repetition: 14,164
Danbooru2020: 14,073
Complement: 9,407
Nootropics: 7,525
GPT-3 & the scaling hypothesis became normalized in this period, so traffic dropped substantially and some old standbys re-emerged, particularly with the annual update of Danbooru20xx.
The site design continued by bringing popups to the mobile masses—they don’t deserve nice things, but we implemented “popovers” for them, which are almost as powerful as desktop popups. (The recursive Wikipedia popups are particularly nerd-pleasing.) Reception to the full-strength popup/popover design has been a bit polarized: design & web dev nerds are impressed by the appearance & functionality (now without parallel anywhere online), but despite our best efforts to make it as intuitive as possible & minimize visual clutter, there’s always a few readers who feel it has gone overboard. Still, I like it, and I would keep it regardless, as a design showcase and a tech demo of how the current World Wide Web falls short of its potential even just as hypertext, much less the full Engelbartian vision.
Aside from that, the major change was refactoring ~60 pages to move topics to their own pages and slim down some of the more gargantuan pages (eg. about a quarter of the GPT-3 page was split out to a GPT-3 Nonfiction page.)
My Patreon profile was up to $1,810.34$1,4552021.
Promotion: Early 2021
Referrals turnover:
HN: 20,329
TWDNE: 11,393
Twitter: 11,104
Reddit: 7,587
This Anime Does Not Exist.ai (TADNE): 2,143
LessWrong: 1,809
Gwern.net: 1,460 (‽)
Facebook: 1,367
Github: 1,316
Social media helped push TADNE & the “cursed computer iceberg” into top-referrer territory, knocking out evanescent competitors from the previous update. The Gwern.net referrers are puzzling, and I have not looked into what might be generating those.
My monthly mailing list has reached 8,308 subscribers, +985.
2020
July 2020–January 2021
This spending of the best part of one’s life earning money in order to enjoy a questionable liberty during the least valuable part of it reminds me of the Englishman who went to India to make a fortune first, in order that he might return to England and live the life of a poet. He should have gone up the garret at once.
Henry David Thoreau (“Economy”, Walden)
Activity graph for this period (2020-07-05–2021-01-03):

Plot of patch creations (y-axis) versus date (x-axis): July 2020–January 2021
Traffic: Late 2020
Analytics traffic records 736,330 page-views by 334,241 unique visitors over the 183 days, or 4,023 page-views per day for an increase of 539 page-views a day compared to the previous 6 months.
(Lifetime total: 11,024,905 page-views by 4,725,245 unique visitors.)

Plot of page-views (y-axis) versus date (x-axis), late 2020
Page rankings (excluding hosted pages):
GPT-3 Creative Fiction: 156,716
index: 57139 + 41849
TWDNE: 36,403
About (likely for the site design discussion): 22,871
Links: 20,774
Faces: 20,565
Spaced repetition: 19,008
May newsletter (scaling essay): 16,167
Complement: 15,266
Danbooru2019: 12,623
I thought that Gwern.net site design was largely done, but—shades of Hofstadter’s law—I spent even more time in this period working with Said Achmiz to rewrite most of the site infrastructure to pay off technical debt, implement true dark mode, and explore fully generalized recursive popups as a design principle.
My Patreon profile was up to $1,680.4$1,3362020, benefitting from further DL work.
Promotion: Late 2020
Referrals changed interestingly:
TWDNE: 28,967
Twitter: 27,904
HN: 12,258
Reddit: 10,262
Towards Data Science (Medium blog): 5,442
Facebook: 3,739
LessWrong: 3,176
Kevin Lacker (blog): 2,190
Github: 1,987
Fantastic Anachronism blog: 1,797
SSC disappears because of Scott Alexander’s dispute with the New York Times & hiatus, and several new referers showed up due to GPT-3 discussions. GPT-3 rockets to the top of the lists because, while almost completely ignored by DL researchers (and thus, the public) when the paper was published in May 2020, OpenAI’s API launch in June 2020 gave a gradually increasing set of people (including myself) a chance to play with it first hand and they discovered shocking examples which eventually led to GPT-3 getting the attention it deserved.
My monthly mailing list has reached 7,323 subscribers, up 1474.
January 2020–July 2020
No, no, let us work just one more hour; let us compose just one more page. Of course we shall not get the book done, but we must keep on trying to finish a little more…When you have a great and difficult task, something perhaps almost impossible, if you only work a little at a time, every day a little, without faith and without hope, suddenly the work will finish itself.
Activity graph for this period (2020-01-03–2020-07-04):

Plot of patch creations (y-axis) versus date (x-axis): Jan 2020–July 2020
Traffic: Early 2020
Analytics traffic records 641,127 page-views by 326,662 unique visitors over the 184 days, or 3,484 page-views per day for a decrease of 404 page-views a day compared to the previous 6 months. Because Gawker linked the Rotten.com archive (sending >400,000 visitors & seriously distorting my analytics), I’ve filtered out the HTML archives entirely & removed the GA code from all HTML pages to obviate the issue, which appears to be responsible for most of the decrease.
(Lifetime total: 8,354,905 page-views by 3,882,482 unique visitors.)

Plot of page-views (y-axis) versus date (x-axis), early 2020
Page rankings (excluding hosted pages):
TWDNE: 64,906
“Ordinary Life Improvements”: 48,178
index: 41624
Spaced repetition: 24,974
Faces: 23,618
About: 19,712
Links: 18,847
May newsletter (GPT-3 scaling essay): 16,877
“GPT-3 Creative Fiction”: 15,739
The rankings changed up a bit due to the remarkable longevity of TWDNE—people apparently never get tired of looking at the faces, that, or people keep discovering it—and due to the success of some shorter pages I wrote to take a break from my deep learning projects like the GPT-2 preference learning/MIDI music-generation (which few cared about) or my GPT-3 work (a little more attention there, but much less than it warranted) Gwern.net site design hasn’t quite finished; the biggest change in this period was a radical experiment in automatically archiving & mirroring most external links to eliminate linkrot entirely.
My Patreon profile was up to $1,412.49$1,1232020 (largely, I suspect, on the strength of the deep learning projects).
Promotion: Early 2020
Referrals changed modestly:
HN: 49,090
TWDNE: 47,996
Twitter: 19,214
SlateStarCodex: 9,193
Reddit: 7,426
Facebook: 6,714
LessWrong: 1,556
Newsletter: 1,411
GitHub: 1,321
Medium: 1,030
My monthly mailing list has reached 5,849 subscribers, up 1502524ya; this forced me to leave TinyLetter due to its 5k subscriber limit and move to Substack (despite attendant technical difficulties).
2019
July 2019–January 2020
Editing is a rewording activity.
Alan Perlis (“Epigrams in Programming” 198244ya)
Activity graph for this period (2019-07-03–2020-01-02):

Plot of patch creations (y-axis) versus date (x-axis): July 2019–Jan 2020
Traffic: Late 2019
Analytics traffic records 715,601 page-views by 349,472 unique visitors over the 184 days, or 3889 page-views per day for an increase of 277 page-views a day compared to the previous 6 months. This is inflated by hosting various HTML archives, particularly the now-defunct DDW’s DNM index which I need for my DNM survival page—taking that out, net traffic appears to have decreased. (Lifetime total: 8,004,312 page-views by 3,814,522 unique visitors.)

Plot of page-views (y-axis) versus date (x-axis), late 2019
Page rankings (excluding hosted pages):
index: 79,033
TWDNE: 44,335
Death Note Anonymity: 27,006
Greenland: 22,887
Faces: 21,124
About: 15,678
Spaced repetition: 14,918
Links: 14,231
Modafinil: 14,229
Danbooru2018: 14,121
DNB FAQ: 10,368
None of the 7 new pages or 5 new long sections were major traffic successes (as much as I was fond of some like “Timing Technology: Lessons from the Media Lab” or Rubrication Design Examples); I continued several GPT-2-related projects, but they didn’t finish in time. Site design was a major focus of my efforts during this period, and I’m pleased with the suite of new popup tools & new margin notes features.
My Patreon profile was up to $1,111.88$8842020.
Promotion: Late 2019
Referrals remained similar:
TWDNE: 29,075
HN: 25,630
Twitter: 10,911
Reddit: 4,516
SlateStarCodex: 4,040
Facebook: 3,841
wykop.pl: 3,400Github: 1,905
Alexey Guzey: 1,381
link.zhihu.com: 1,083
My monthly mailing list has reached 4347 subscribers, up 788.
January 2019–July 2019
You think you know when you learn, are more sure when you can write, even more when you can teach, but certain when you can program.
Alan Perlis (“Epigrams in Programming” 198244ya)
Activity graph for this period (2019-01-04–2019-07-02):

Plot of patch creations (y-axis) versus date (x-axis): January–July 2019
Traffic: Early 2019
Analytics traffic records 653,876 page-views by 325,842 unique visitors over the 181 days, or 3612 page-views per day for an increase of 1398 pageviews a day compared to the previous six months. (Lifetime total: 7,286,760 page-views by 3,431,759 unique visitors.)
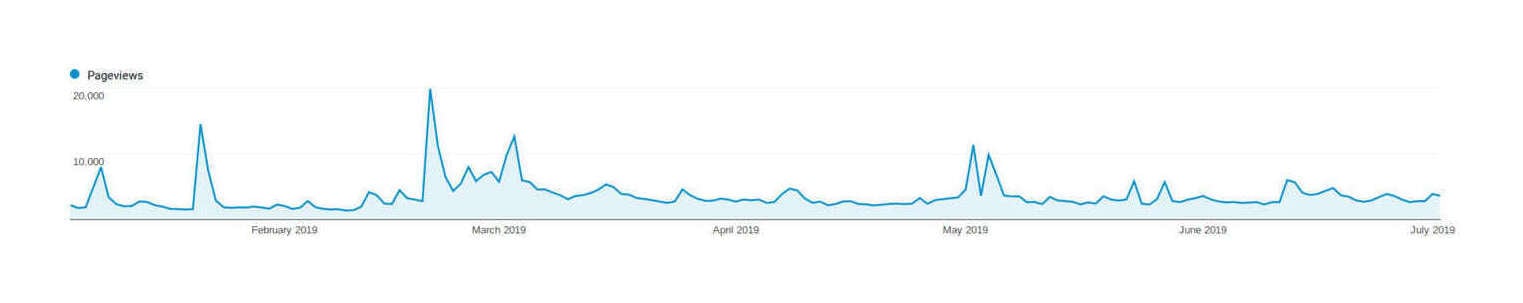
Plot of page-views (y-axis) versus date (x-axis), early 2019
This Waifu Does Not Exist site writeup: 95,635
index: 97,767
Danbooru2018: 30,936
Complement: 28,165
Spaced-repetition: 26,846
CO2/ventilation sleep experiment: 20,368
Making Anime Faces With StyleGAN tutorial: 17,616
Links: 14,594
Modafinil: 14,488
About: 14,057
Everything Is Correlated: 11,738
The main event in early 2019 was the release of the StyleGAN codebase, which I immediately began using to generate anime faces; it worked even better than I hoped, creating amusing 512px anime faces in a fraction of the time of ProGAN. For a lark, in February I created a simple little static website, ThisWaifuDoesNotExist.net (TWDNE) to show off random face samples, which then went viral, quickly receiving over a million visits (mostly from China). I enhanced TWDNE with additional StyleGAN improvements and anime plot summaries generated by GPT-2, and wrote up the StyleGAN training & and website details as tutorials, which benefit from the still-considerable traffic and have been useful to many people training their own StyleGANs.
My Patreon profile was steady at $1,069.09$8382019.
Promotion: Early 2019
Referrals changed dramatically, driven mostly by TWDNE:
thiswaifudoesnotexist.net: 75,707news.ycombinator.com: 34,761t.co: 12,744reddit.com: 7,993slatestarcodex.com: 4,754m.facebook.com: 2,476link.zhihu.com: 1,886github.com: 1,746mail01.tinyletterapp.com: 1,342old.reddit.com: 1,164
My monthly mailing list has reached 3,559 subscribers, up ~806.
2018
July 2018–January 2019
Is not a patron, my lord, one who looks with unconcern on a man struggling for life in the water, and when he has reached ground, encumbers him with help?
Samuel Johnson (Letter to Chesterfield, 1755271ya)
Activity graph for this period (2018-07-04–2019-01-03):

Plot of patch creations (y-axis) versus date (x-axis): July 2018–January 2019
Traffic: Late 2018
Analytics traffic records 407,395 page-views by 185,141 unique visitors over the 184 days, or 2214 page-views per day for an increase of 396 pageviews a day compared to the previous six months. (Lifetime total: 6,638,722 page-views by 3,113,460 unique visitors.)

Plot of page-views (y-axis) versus date (x-axis), late 2018
index: 50,849
Turing-complete: 26,662
Notes: (for open questions/Littlewood’s Law): 17,706
Spaced repetition: 14,471
Modafinil: 13,958
“Bitcoin Is Worse Is Better”: 13,169
DNB FAQ: 10,344
Links: 9,729
Drug heuristics/Algernon’s Law: 9,724
And honorable mentions for the new pages “Internet Search Tips” which almost made it to the top 10 (#13) despite being released mid-way December 2018, and Cat Sense, Bradshaw 201313ya: Are We Good Owners? (on cat psychology, genetics, domestication, & dysgenics) at #21.
I was disappointed that two of my new ones had little or no interest (“My Little Pony: Immanetizing The Equestrian” & “Multi-Stage Selection Bean Machine JS Demo”), and that Danbooru2017, despite its use in the impressive style2paints v4, saw little uptake. Maybe Danbooru2018 will do better.
My Patreon profile increased to $1,097.22$8352018.
Promotion: Late 2018
Referrals saw some unusual changes:
HN: 37,603
Twitter: 10,909
Reddit: 6,046
Slate Star Codex: 4,479
Facebook: 1,389
Github: 1,209
CoinMarketCap: 1,115
TinyLetter: 1,089
Alexey Guzey: 795
LessWrong: 782
My monthly mailing list has reached 2753 subscribers, up ~570.
January 2018–July 2018
People will have their miracles, their stories, their heroes and heroines and saints and martyrs and divinities to exercise their gifts of affection, admiration, wonder, and worship, and their Judases and devils to enable them to be angry and yet feel that they do well to be angry. Every one of these legends is the common heritage of the human race; and there is only one inexorable condition attached to their healthy enjoyment, which is that no one shall believe them literally. The reading of stories and delighting in them made Don Quixote a gentleman: the believing them literally made him a madman who slew lambs instead of feeding them.
Activity graph for this period (2018-01-04–2018-07-03):

Plot of patch creations (y-axis) versus date (x-axis): January 2018–July 2018
Traffic: Early 2018
Analytics traffic records 329,057 page-views by 148,481 unique visitors over the 181 days, or 1818208ya page-views per day for a daily increase of 42 pageviews a day compared to the previous six months. (Lifetime total: 6,236,345 page-views by 2,945,757 unique visitors.)

Plot of page-views (y-axis) versus date (x-axis), early 2018
index: 43,535
Modafinil: 16,339
DNB FAQ: 15,922
Spaced repetition: 15,599
“Danbooru2017: A Large-Scale Crowdsourced & Tagged Anime Illustration Dataset”: 10,531
Nootropics: 8,020
Links: 7,105
DNM arrests: 6,707
Death Note Anonymity: 6,464
“Laws of Tech: Commoditize Your Complement” is based on an old Joel Spolsky essay I found insightful and to explain a lot of puzzling behaviors in Silicon Valley, so I was surprised when, during my SF trip, no one who I mentioned it to in discussions of technology had heard of it; I returned resolved to try to promote it some more by re-emphasizing it and collating a list of examples so no one could fail to see the pattern, and I believe I succeeded. The launch of Danbooru2017 was less satisfying. I kept running into difficulties and delays, most associated with how to format the metadata (provided in a not-too-useful JSON format)—indeed, I had expected to launch it in April 2017 and build my deep learning workstation in December 2017. Instead, it wasn’t until February 2018 that I gave up on the metadata, reasoning that I was letting the perfect be the enemy of better, and until July 2018 that I finished building my workstation with 2 GPUs (after 2 dead motherboards, among other problems). There have been somewhere around 200 downloads of the dataset as far as I can extrapolate from the torrent client upload & rsync logs, but thus far I only know of 1 serious use of it (a CycleGAN paper). I remain hopeful that uses will gradually increase over the next few years, the way they did for my darknet market dataset; in any case, I’ve begun working on some uses of Danbooru2017 myself.
My Patreon profile decreased to $880.41$6702018.
Promotion: Early 2018
Referrals:
HN: 13,533
Reddit: 6,686
Twitter: 6,529
Slate Star Codex: 6,246
Facebook: 2,830
adme.ru: 2,414Android Google Search: 788
The Browser: 562
4chan: 523
Duck Duck Go: 521
My monthly mailing list has reached 2183 subscribers, up ~307. By crossing the 200026ya subscriber mark, MailChimp disabled my account and began charging $39.42$302018 a month to send out a single newsletter; as it’s a little hard for me to justify spending anywhere up to $525.62$4002018/year on my newsletter, which I don’t directly make any money on, I had to stop using MailChimp. after looking around some, I switched to TinyLetter, which oddly enough is also run by MailChimp but doesn’t have that arbitrary subscriber limit (though it lacks many features of MailChimp proper).
2017
July 2017–January 2018
It is only the attempt to write down your ideas that enables them to develop.
Wittgenstein to Drury (Recollections of Wittgenstein, Rhees 198442ya)
Activity graph for this period (2017-07-04–2018-01-03):

Plot of patch creations (y-axis) versus date (x-axis): July 2017–January 2018
Traffic: Late 2017
Analytics traffic records 326,852 page-views by 155,532 unique visitors over the 184 days, or 1776250ya page-views per day for a daily increase of 513 visits compared to the previous six months. (Lifetime total: 5,931,837 page-views by 2,763,402 unique visitors.)

Plot of page-views (y-axis) versus date (x-axis), late 2017
Page rankings (somewhat scrambled due to the big renaming and GA not merging analytics across URLs):
index: 43,863
Banner Ads Considered Harmful: 20,013
Modafinil: 14,340
DNM arrests: 14,115
The Neural Net Tank Urban Legend: 13,808
DNB FAQ: 13,650
Bitcoin Is Worse Is Better: 11,401
Spaced repetition: 12,428
Reasons of State: Why Didn’t Denmark Sell Greenland?: 11,150
Nootropics: 7,615
My A/B test of banner ads turned in an unexpected result of substantial harm, which was of considerable general interest (especially to anyone who runs an ad-supported website), so no surprise that had a lot of traffic. I wrote off the obscure neural net/tank story years ago after some cursory investigation showed it had all the classic traits of an urban legend; but it has kept coming up, and at Anders Sandberg’s request, I wrote it up in considerably more detail, and was surprised that people took such an interest in it and even defended it as probably genuine, in the absence of all evidence—I guess people like debunkings? The final oddity was the resurgence of my old essay on an extremely obscure bit of US historical trivia, that it had tried to acquire Greenland in the early Cold War, where I noted that Denmark’s refusal was a costly one; I don’t know why anyone was reading it, but I was annoyed at the idiotic objections people made, typically either pure fantasy, already refuted like the many suggestions that Greenland oil would yet pay off, or illogical virtue signaling—ironically demonstrating my point. (Considerable effort invested in defining hundreds of redirects for 404 errors didn’t pay off as people kept discovering ever new ways to misspell URLs, but it did allow me to rename pages without destroying traffic by breaking most incoming links, switching from spaces to hyphens in order to idiot-proof them.)
My Patreon profile has increased to $943.74$7002017.
Promotion: Late 2017
As before, I did minimal active promotion of my content. Referrals:
HN: 26,112
Reddit: 10,715
Marginal Revolution: 8,064
Twitter: 7,111
Slate Star Codex: 5,906
Facebook: 2228
LessWrong: 1,547
The Browser: 1,057 (this would have been higher if The Browser had not carelessly broken its URL due to the space-escaping issue, which prompted my site-wide renaming)
Duck Duck Go: 782
Longecity: 777
My monthly mailing list has reached 1786240ya subscribers, up ~367.
January 2017–July 2017
Authors write things down so as to have to think of them less.
Activity graph for this period (2017-01-04–2017-07-03):

Plot of patch creations (y-axis) versus date (x-axis): January 2017–July 2017
Traffic: Early 2017
Analytics traffic records 228,652 page-views by 112,814 unique visitors over the 181 days, or 1263 page-views per day for a daily decrease of 582 visits compared to the previous six months. (Lifetime total: 5,604,985 page-views by 2,609,657 unique visitors.)

Plot of page-views (y-axis) versus date (x-axis), early 2017
Page rankings:
Modafinil: 16,980
Spaced repetition: 14,484
LSD microdosing: 13,394
DNB FAQ: 10,145
“Ted Chiang’s ‘Story Of Your Life’ Is Not A Time-Travel Story”: 9,760
Nootropics: 9,309
DNM arrests: 8,148
Silk Road: 6,456
Links: 5,668
About: 5,176
Aside from a critical exegesis of “Story Of Your Life” (prompted by its successful movie adaptation), I spent much of early 2017 tweaking Gwern.net and working on unpopular statistics projects (particularly “The Kelly Coin-Flipping Game: Exact Solutions via Decision Trees”, which though thorough and highly educational for myself, like “When Should I Check The Mail?”, will never be popular reading). In late 2017, I hope to finish up many draft or in-progress works, which may help maintain traffic.
After rewriting & including social proof & tweeting, my Patreon profile has increased to $808.92$6002017.
Promotion: Early 2017
As before, I did minimal active promotion of my content. Referrals:
HN: 10,881 (“Story Of Your Life” was an unexpected hit)
Reddit: 9,538
Twitter: 3,702
Facebook: 2,274
LessWrong: 1,568
Slate Star Codex: 1,462
rs.io: 1,315Longecity: 1,071
Brain Workshop: 861
DuckDuckGo: 820
My monthly mailing list has reached 1419 subscribers, up ~207.
2016
July 2016–January 2017
With the people of the past
How I wish I could share the beauty
Of these cherry blossoms.
Have each of us across the years
Left behind this very thought?Fujiwara no Teika (“Shogaku Hyakushu”, 1181 AD, trans. Bundy 1990)
Activity graph for this period (2016-07-04–2017-01-03):

Plot of patch creations (y-axis) versus date (x-axis): July 2016–January 2017
Traffic: Late 2016
Analytics traffic records 339,529 page-views by 172,203 unique visitors over the 184 days, or 1845181ya page-views per day for a daily increase of 230 compared to the previous six months. (Lifetime total: 5,376,333 page-views by 2,499,949 unique visitors.)

Plot of page-views (y-axis) versus date (x-axis), late 2016
Page rankings:
Nootropics: 43,266
index/main page: 39,161
Spaced repetition: 26,965
Modafinil: 26,849
DNM arrests: 16,279
LSD microdosing: 12,943
DNB FAQ: 10,501
In Defense of Inclusionism: 7,037
Links: 6,677
My Patreon profile has largely leveled off at a constant $429.23$3102016.
Promotion: Late 2016
As before, I did minimal active promotion of my content.
HN: 42,341
Traffic was driven primarily by a few big HN submissions by other people.
Reddit: 16,151
Twitter: 4,915
Facebook: 4,702
rs.io: 1,585Longecity: 1,175
thethirdwave.co: 1,171DuckDuckGo search: 990
brainworkshop.sourceforge.net: 912Wikipedia: 794
My monthly mailing list has reached 1212 subscribers, up ~200.
January 2016–July 2016
It is easy enough to say that man is immortal simply because he will endure: that when the last ding-dong of doom has clanged and faded from the last worthless rock hanging tideless in the last red and dying evening, that even then there will still be one more sound: that of his puny inexhaustible voice, still talking. I refuse to accept this. I believe that man will not merely endure: he will prevail.
William Faulkner (1950 Nobel Prize speech)
Activity graph for this period (2016-01-04–2016-07-03):

Plot of patch creations (y-axis) versus date (x-axis): January 2016 to July 2016
Traffic: Early 2016
Analytics traffic records 294,009 page-views by 141,795 unique visitors over the 182 days, or 1615411ya page-views per day for a daily decrease of 937 compared to the previous six months. (Lifetime total: 5,036,804 page-views by 2,329,713 unique visitors.)

Plot of page-views (y-axis) versus date (x-axis), early 2016
Page rankings:
homepage/index: 35,673
Modafinil: 33,928
LSD microdosing: 21,712
DNM arrests: 14,322
Spaced repetition: 14,044
Nootropics: 12,117
DNB FAQ: 10,983
Silk Road: 7,654
About: 6,642
Links: 6,410
My Patreon profile continues to be a success.
Promotion: Early 2016
As before, I did minimal active promotion of my content.
Reddit: 17,792
Facebook: 4119
Twitter: 2,572
HN: 2,518
Slate Star Codex: 2,467
LessWrong: 2,135
Longecity: 1,555
rs.io: 1,440
brainworkshop.sourceforge.net: 1,035MetaFilter: 1,018
My monthly mailing list has reached 1053 subscribers.
2015
July 2015–January 2016
We will never run out of things to program as long as there is a single program around.
Alan Perlis (“Epigrams in Programming” 198244ya)
Activity graph for this period (2015-07-03–2016-01-03):

Plot of patch creations (y-axis) versus date (x-axis): July 201511ya to January 2016
Traffic: Late 2015
Analytics traffic records 472,244 page-views by 400,305 unique visitors over the 185 days, or 2552 page-views per day for a daily increase of +461 compared to the previous six months. (Lifetime total: 4,742,795 page-views by 2,191,138 unique visitors.)

Plot of page-views (y-axis) versus date (x-axis), late 2015
Page rankings:
Modafinil: 67,152
home/main page: 50708
DNM archives 2011–4201511ya: 44,164
LSD microdosing: 22,078
char-rnnfor mimicking CSS: 20,581DNM arrests: 18,524
Nootropics: 15,709
Terrorism is not about Terror: 15,223
Spaced repetition: 14,903
DNB FAQ: 13,954
Silk Road: 11,606
The new entry here, “DNM archives”, is the culmination of my DNM work: mirrors/scrapes of dozens of markets, along with all sorts of archives and datasets related to the DNMs, covering years of market activity (1.2tb in total, to give an idea of scope). The other 2 surprises were a tutorial on how to set up char-rnn on an Amazon EC2 instance and train it to generate remarkably valid CSS (suggesting that it may be possible to train a reinforcement-learning deep neural network to design the visual appearance of websites and optimize the appearance based on visitor experiments), and an old little compilation I made of things exhibiting Turing-completeness which I found bizarre or surprising or disturbing (which naturally led to a lot of nitpicking and debate over definitions).
My Patreon profile, set up after I was forced out of Gratipay, has been a smashing success, with generally ~$430.75$3002015/month in donations.
Promotion: Late 2015
As before, I did minimal active promotion of my content.
news.ycombinator.com: 51,256reddit.com: 25,479Twitter (
t.co): 7,748Slate Star Codex: 3,166
Facebook: 3,044
lesswrong.com: 3,035Disqus: 2,042
Bullet Proof Exec: 1,931
Longecity: 1,887
Wired: 1,854
(I have no idea why Facebook traffic increased so much, since the referrers are useless.)
My monthly mailing list has reached 857 subscribers.
January 2015–July 2015
‘“The horror of that moment,” the King went on, “I shall never never forget!” “You will, though”, the Queen said, “if you don’t make a memorandum of it.”’
Lewis Carroll (Through the Looking-Glass, and What Alice Found There)
Activity graph for this period (2015-01-03–2015-07-0211ya):

Plot of patch creations (y-axis) versus date (x-axis): January 201511ya to July 2015
Traffic: Early 2015
Analytics traffic records 378,580 page-views by 175,303 unique visitors over the 181 days, or 2091 page-views per day for a daily increase of +203 compared to the previous six months. (Lifetime total: 4,270,551 page-views by 1,949,700 unique visitors.) This is better than the previous drop but may be due mostly to some additional spikes from HN.

Plot of page-views (y-axis) versus date (x-axis), early 2015
Page rankings:
Modafinil: 48,259
home/main page: 48,614
Darknet Market (DNM) arrests: 20,312
Spaced repetition: 17,522
DNB FAQ: 16,076
Silk Road: 15,116
LSD microdosing: 13,673
Nicotine: 9,804
Links: 9,234
Death Note Anonymity: 9,234
The new entry here, “DNM arrests”, is a long-term project in which I compile all the several hundred known and inferable arrests/prosecutions related to Silk Road 1 and its successor DNMs; it can be very difficult to find details for individual cases (often requiring hours reading court documents for a key detail) or keep track of them, and only recently was I able to clear out my backlog and present it to the community. But it’s useful in giving people an authoritative idea of the risks and what people are arrested for, and I’m pleased to see that it’s being read & consulted. “LSD microdosing” seems to be getting more traffic due to some recent media coverage of the idea and people linking to my writeup as (still) the only blinded self-experiment on the topic.
Gratipay, unfortunately, has been forced to change due to financial regulations and is no longer useful for donations. It had a good run but I will probably be switching to Patreon.
Promotion: Early 2015
As before, I did minimal active promotion of my content.
reddit.com: 27,783news.ycombinator.com: 11,538lesswrong.com: 3,264Twitter (
t.co): 2,700Slate Star Codex: 2,357
Longecity: 1,871
brainworkshop.sourceforge.net: 1,403Deep Dot Web: 1,226
rs.io: 1,197Facebook: 1,148
My monthly mailing list has reached 606 subscribers.
2014
July 2014–January 2015
Writing is in itself a joy,
Yet saints and sages have long since held it in awe.For it is being, created from a void;
It is sound rung out of profound silence.
In a sheet of paper is contained the infinite,
And, evolved from an inch-sized heart, an endless panorama.Lu Chi’s Wen fu (§4 ‘The Joy of Writing’, “The Art of Writing”)
Activity graph2 for this period (2014-07-03–2015-01-0211ya):

Plot of patch creations (y-axis) versus date (x-axis): July 201412ya to January 2015
Traffic: Late 2014
Analytics traffic records 347,482 page-views by 154,599 unique visitors over the 184 days, or 1888138ya page-views per day for a daily drop of 159 compared to the previous six months. (Lifetime total: 3,891,971 page-views by 1,778,197 unique visitors.) This drop is not nearly as bad before, and may represent a bottom.

Plot of page-views (y-axis) versus date (x-axis), late 2014
Page rankings:
Modafinil: 44,420
home/main page: 41,499
Nootropics: 41,499
Silk Road: 21,863
Spaced repetition: 17,620
Causality: 15,396
DNB FAQ: 14,463
Time-lock crypto: 11,313
Nicotine: 9,804
Links: 8,823
Silk Road declines a little more; the Wei Dai/Satoshi Nakamoto emails pages drop out after their moments in the limelight; and we see 2 new entries: I wrote a statistical essay on quantifying how often correlation ≠ causality (a topic of burning importance in almost any health-related research), and an older cryptography essay became abruptly more relevant when one of my proposals was implemented using Bitcoin.
Gratipay continues to work well, and I am grateful for all my donators.
Promotion: Late 2014
I did minimal active promotion of my content, letting my AdWords credit be used up and not spending much effort on Reddit or Hacker News. Confusingly, HN is back in my referrals:
reddit.com: 27,182news.ycombinator.com: 18,420lesswrong.com: 4,583Twitter: 3,559
slatestarcodex.com: 2,327Longecity: 2,143
bulletproofexec.com: 2,123boldanddetermined.com: 1,488brainworkshop.sourceforge.net: 1,346disqus.com: 1,276
My monthly mailing list continued, having reached 456 subscribers.
January 2014–July 2014
A courteous handsome young man
well-versed in the Classics and Histories
people address him sir
everyone calls him a scholar
but he hasn’t found a position yet
and he doesn’t know how to farm
in winter he wears a tattered robe
this is how books fool us
Activity graph3 for this period (2014-01-03–2014-07-0212ya):

Plot of patch creations (y-axis) versus date (x-axis): January to July 2014
Traffic: Early 2014
Analytics traffic records 370,592 page-views by 162,032 unique visitors over 181 days, or 2047 page-views per day. (Lifetime total: 3,544,489 page-views by 1,628,173 unique visitors.) Since the previous period was 4186/day, that means traffic fell by a disastrous ~50%, defeating my hopes that traffic might recover post-Silk-Road & Hacker News experiment

Plot of page-views (y-axis) versus date (x-axis), early-mid 2014
The traffic rankings show a continue in the plummet of SR, and its dethroning by Modafinil and even the index page, while hosting some early Satoshi Nakamoto drew considerable interest & my “Intellectual Mistakes I Have Made” page was surprisingly linked on Tyler Cowen’s Marginal Revolution blog:
Modafinil: 54,992
home/main page: 43,984
Silk Road: 27,998
Spaced repetition: 27,680
DNB FAQ: 17,833
Nootropics: 15,935
Mistakes: 15,267
Nicotine: 11,936
Links: 9,391
On the plus side, it’s hard to see how traffic could fall much more.
Finance-wise, Gratipay has worked out much better than I expected. I thank all my donators.
Promotion: Early 2014
Hacker News turns out to no longer show up in the referrals analytics due to stripping referrals (apparently related to HTTPS use?), which is unfortunate; I suspect other sites are also “going dark”, given that the numbers are more than halving:
reddit.com: 24,176marginalrevolution.com: 5,695bulletproofexec.com: 5,504disqus.com: 4,051lesswrong.com: 3,954longecity.org: 3,051Twitter: 2,771
boldanddetermined.com: 2,54vice.com: 1,812brainworkshop.sourceforge.net: 1,625
I also began a monthly mailing list; with 300 people on it, it doesn’t seem to make a big difference to traffic but it’s a good way to curate my links and non-Gwern.net writings, and may be quite useful.
2013
July 2013–January 2014
The great globe reels in the solar fire,
Spinning the trivial and unique away.
(How all things flash! How all things flare!)
…Time is the school in which we learn
Time is the fire in which we burn…Delmore Schwartz (“Calmly We Walk Through This April’s Day”)
darcs-graph for this period (2013-07-03–2014-01-0212ya):

Plot of patch creations (y-axis) versus date (x-axis): July 201313ya to 2014-01-02
Traffic: Late 2013
Analytics traffic records 770,264 page-views by 340,104 unique visitors over 184 days, or 4186 page-views per day. (Lifetime total: 3,173,172 page-views by 1,472,606 unique visitors.) Since the previous period was 4598/day, that means traffic fell by ~9%. (Traffic would have fallen even more if I hadn’t happened to be engaged in a successful campaign of Hacker News submissions at the time.) My guess is that this is largely attributable to the fall of Silk Road in early October rendering my page of much less interest, and that was one of my most popular pages. It was inevitable, really, but I had hoped SR would last more than <3 years. Traffic may fall or increase during the next period.

Plot of page-hits (y-axis) versus date (x-axis), mid-late 2013
This rebalancing is evident in the traffic rankings, where SR is still #1 and bigger than #2 (Modafinil), but by a much smaller factor this time (1.26x rather than 6.66x):
Silk Road: 80,233
Modafinil: 63,966
home/main page: 65,203
Melatonin: 50,952
Blackmail attempts: 36,573
Spaced repetition: 35768
LSD microdosing self-experiment: 26,825
Nicotine: 25,370
DNB FAQ: 23,169
Nootropics: 20,883
My finances continued to improve in part due to Whiteford, additional donations (I explored Flattr & Gratipay; the latter seems to be working out better), another more-targeted banner on the modafinil page, and a major appreciation in Bitcoin. (Takes a real load off me.) I thank all my donators. I think the results show in my Changelog.
Promotion: Late 2013
reddit.com: 148,940news.ycombinator.com: 84,163lesswrong.com: 41,511en.wikipedia.org: 31,967facebook.com: 20,394t.co[Twitter]: 19,628brainworkshop.sourceforge.net: 16,808bulletproofexec.com: 11,135google.com[Google+?]: 10,154mainstreamlos.tumblr.com: 10,128
Interestingly, despite my Hacker News experiment (which resulted in dozens of my pages reaching its main page), news.ycombinator.com is still beaten out traffic-wise by Reddit, by a huge factor (almost double).
January 2013–July 2013
I was decimated. To program any more would be pointless. My programs would never live as long as The Trial. A computer will never live as long as The Trial. …What if Amerika was only written for 32-bit PowerPC?
_why the lucky stiff (CLOSURE)
darcs-graph for this period (2013-01-03–2013-07-0213ya):

Plot of patch creations (y-axis) versus date (x-axis): January 201313ya to 2013-07-02
Traffic: Early 2013
Analytics traffic records 832,415 page-views by 422,285 unique visitors over 181 days, or 4598 page-views per day. (The lifetime total page-views has thus reached 2,403,807.) This represents ~11% growth in traffic compared to the previous 6-month period of 4,124 dailies, continuing the slowdown trend—possibly the next half-year won’t see any growth, or a decline.

Plot of page-hits (y-axis) versus date (x-axis), early-mid 2013
Popularity rankings have changed: Silk Road lost a lot of Wikipedia traffic when, during an editing dispute, an administrator deleted it from their article on Silk Road, and it was only restored on 2 July. 2 new statistical essays (Death Note script & Google survival analysis) enter the top 10, but neither were able to dethrone Silk Road as that darknet market continued to thrive & receive media coverage:
Silk Road: 396,993
Modafinil: 58,856
Google shutdowns: 49,907
DNB FAQ: 25,979
Death Note script: 25,792
Nootropics: 22,702
home/main page: 20,051
Links: 16,789
About: 14,746
Spaced repetition: 11,711
Financial: this period was a remarkable period. My contracting work dried up (largely my own fault) and pressed for money, I began exploring alternatives:
the easiest strategy was to turn all my Amazon links for books & nootropics & miscellaneous into affiliate links; they are already there, do not affect readers, and coding it up was as simple as appending a string to links in
hakyll.hsby a simple modification of my existing code for easily linking to Wikipedia. This worked as far as it went, which was not very far ($70.55$472013 in Q1 201313ya and $195.14$1302013 Q2 201313ya).more painfully, I decided to try Google’s AdSense. While AdWords hadn’t been the most pleasant experience in the world, it was fairly decent, and Google’s ads always seemed reasonable to me in the search engine (before I learned of AdBlock). AdSense has scary language in its terms of service forbidding detailed discussion of revenue, but I should be safe when I say that the mean CTR was 0.17% & the mean CPC was $0.86$0.572013, ~40% of visitors did not have ad filtering enabled, and so over the 80 days AdSense was enabled, I earned ~$390.29$2602013. Helpful, but not rent-paying. (In the long run, ads turned out to be a bad idea.)
donations made the difference. After “Google shutdowns” hit the front page of Hacker News, an acquaintance mentioned I could use some money. I received $612.45$4082013 in 14 Paypal donations; through Bitcoin, $471.99₿1.622013 (then $283.71$1892013) in 4 donations (followup). I am grateful to all the HNers who donated.
Related to that, I was contacted in May by Nava Whiteford with an offer: he had heard my financial target of $450.33$3002013/month and offered that (in bitcoins) in exchange for a sponsorship/banner linking to his graphical terminal HTerm—a combination purchase/donation. This was both larger & more stable than AdSense, so I accepted, and 3 months have thus far passed.
Promotion: Early 2013
Wikipedia declines in this period due to the aforementioned removal, and more obscure sites become chief referrers:
news.ycombinator.com: 45,186reddit.com: 34,225en.wikipedia.org: 16,527lesswrong.com: 11,177Twitter: 6,717
facebook.com: 5,675mainstreamlos.tumblr.com: 5,576boingboing.net: 4,982motherboard.vice.com: 4,496bulletproofexec.com: 4,336
2012
July 2012–January 2013
All I say is by way of discourse, and nothing by way of advice. I should not speak so boldly if it were my due to be believed.
Michel de Montaigne (“Of Cripples”, Essays)
darcs-graph for this period (2012-07-03–2013-01-0213ya):

Plot of patch creations (y-axis) versus date (x-axis): July 201214ya to 2013-01-02
Traffic: Late 2012
Analytics traffic records 758,843 page views by 366,028 unique visitors over the 184 days for a daily average of 4,124.1 page-views, which is double the previous half-year average of 2,012 daily page-views; traffic growth is clearly slowing, though, since the previous half-year had quadruple the traffic compared to its predecessor. My prediction of breaking the million page-view mark came true, by a very large margin: the lifetime total page-views is now 1,568,957 page-views.

Plot of page-hits (y-axis) versus date (x-axis), late 2012
Popularity rankings have changed a bit: the Death Note essay and my sleep experiments have fallen out of the top 10 (the former because not many people are still linking it, and the latter probably because my latest experiments were relatively boring), replaced by a sidebar link and one of my terrorism-related essays:
Silk Road: 491,934
home/main page: 37,853
Modafinil: 31,047
DNB FAQ: 27,433
Nootropics: 22,015
Drug heuristics/Algernon’s Law: 18,991
Spaced repetition: 11,693
Links: 8,123
About: 8,075
I am quite surprised that my Slowing Moore’s Law essay does not even make the top 50 pages, given that it deals with an novel thesis on which there’s many interesting things to think and which is easily misunderstood.
Donations: the ebook fell through when O’Reilly decided to cancel the entire series, which was a disappointment; Carmichael had finished her book on mood and is self-publishing, but I haven’t seen tremendous interest in sleep and will probably just roll my draft material into the existing Zeo page. Paypal donations performed outstandingly: I received $15.01$102013, $37.53$252013, $15.01$102013, $22.52$152013, $300.22$2002013, & $15.01$102013 ($405.3$2702013). Bitcoiners were not so generous: $7.48₿0.252013, $9.58₿0.322013, & $29.92₿12013 ($46.98₿1.572013, or $31.52$212013 at the 2013-01-02 Mt.Gox exchange rate).
Promotion: Late 2012
To Hacker News, Reddit, and LessWrong, I can add as a major referrer Wikipedia—primarily to the Silk Road article, but also to a few Evangelion-related pages. StumbleUpon has declined to the 10th largest referrer:
HN: 16,886
Reddit: 15,219
Wikipedia: 7,531
LessWrong: 6,332
Facebook: 3,952
brainworkshop.sourceforge.net: 3,733google.com: 2,649youtube.com: 1,798mainstreamlos.tumblr.com: 1,694stumbleupon.com: 1,239
I haven’t spent much time promoting my content, but improving the site with metadata & writing new content: for example, I tripled the size of my anime-manga hafu census database.
January 2012–July 2012
Uproot your questions from their ground and the dangling roots will be seen. More questions!
Frank Herbert (“Mentat Zensufi admonition”, Chapterhouse Dune)
darcs-graph for this period (2012-01-03–2012-07-0214ya):

Plot of patch creations (y-axis) versus date (x-axis): January 201214ya to 2012-07-02
Traffic: Early 2012
If it were not for the intellectual snobs who pay—in solid cash—the tribute which philistinism owes to culture, the arts would perish with their starving practitioners. Let us thank heaven for hypocrisy.
Aldous Huxley (“Indian & Burma”, Jesting Pilate, 1926100ya)
The Analytics report records traffic over those 182 days as being substantially increased: to 570,997 page-views (average 3,137/day) - almost 5 times the previous six month period—by 268,031 unique visitors in 366,301 visits (average 201214ya/day). If this rate continues, I will likely lose my traffic prediction (which doesn’t bother me very much). In particular, the lifetime total page-views is now at 809,000, which would seem to imply that I will break the million page-view mark by the next update! I would be very pleased by that milestone.

Plot of page-hits (y-axis) versus date (x-axis), early 2012
The popularity ranking remains mainly the same. 2 differences from the past stand out: the sudden popularity of the Zeo and “Death Note Anonymity” articles. Both owe their inclusion to 2 successful front-page appearances on Hacker News. DNA was submitted by someone I don’t know, but I submitted the Zeo page at the conclusion of my first Vitamin D experiment where I concluded that that Vitamin D consumed in the evening did indeed damage my sleep (I then followed up with a second experiment which found that Vitamin D consumed in the morning did not damage my sleep.) I am proud of these two experiments and so I was gratified that Hacker News found them worthwhile too.
Silk Road: 308,895
DNB FAQ: 36,488
home/main page: 32,259
Modafinil: 23,801
Nootropics: 21,970
Death Note Anonymity: 15,860
Zeo sleep self-experiments: 15,841
Spaced repetition: 8,628
Links: 7,431
Donation-wise, I received ~$31.39₿22012, and a number of Paypal donations: $7.51$52013, $6$42013, $7.51$52013, and $150.11$1002013 from a particularly generous LessWronger who wished me to backup my files more securely & remotely. Alexandra Carmichael was impressed by my Zeo experiments and asked me to write an ebook on sleep for an upcoming Quantified Self series of O’Reilly ebooks; we will see how that goes.4
Promotion: Early 2012
Hacker News, Reddit, and LessWrong remain major referral drivers. For recent new pages, I’ve been trying a checklist which includes submission to SU, Google+, Hacker News, Reddit, and LessWrong as appropriate; I am not sure how well it is working since popularity seems very random.
2011
July 2011–December 2011
Res audita perit, litera scripta manet.
Proverb
darcs-graph for this period (including 2012-01-01):

Plot of patch creations (y-axis) versus date (x-axis): July 201115ya to 2012-01-02
I ran into a cool post by Christopher Done on a tool that does detailed analysis of patch patterns on a Git repository, GitStats, and this spurred me to create a Git mirror of Gwern.net using darcs-to-git. GitStats produces a whole bundle of graphs and figures, some of which I found surprising. (I did not expect to see a large spike on Wednesday and relatively few patches on Saturday, or a spike around 5 PM, as opposed to the early morning.) I think I will update the GitStats output with each output, as a (large) adjunct to the darcs-graph plots.
Traffic: Late 2011
Ah! let not Censure term our fate our choice,
The stage but echoes back the public’s voice;
The drama’s laws the drama’s patrons give,
For we that live to please must please to live.
…prompt no more the follies you decry,
As tyrants doom their tools of guilt to die;
’Tis yours this night to bid the reign commence
Of rescu’d Nature, and reviving Sense;
…Bid scenic Virtue form the rising age,
And Truth diffuse her radiance from the stage.Samuel Johnson (“Prologue at the Opening of Drury Lane Theatre”)
Google Analytics reports, that over the 185 days between 2011-07-02 and 2012-01-02, there were 191,015 page-views (average 1,032/day) by 79,346 visitors for a total of 115,585 visits (average 624/day). This is better than I expected and makes me wonder about my prediction for <200026ya average daily visits by 201313ya (but it still seems unlikely traffic will triple over the next year).

Plot of page-hits (y-axis) versus date (x-axis)
The main change in page popularity did not surprise me; when I was writing “Silk Road 1”, I knew it would almost certainly be popular given how very popular the Gawker article was but also how lacking in practical details it was, and I also suspected that “Bitcoin is Worse is Better” would be fairly popular as it argued an interesting and controversial thesis (the original and promoted version is hosted on BitcoinWeekly.com, so its hit-count ought to be low). I’m surprised at how much the page Gwern.net still gets; a surprising number of people must either visit the main page after reading another article or click on my various blog comments.
Silk Road: 62,167
DNB FAQ: 25,541
home/main page: 16,967
Modafinil: 10,437
Nootropics: 10,219
Spaced repetition: 6,570
Bitcoin is Worse is Better: 4,297
Links: 3,490
More interesting is the other signals of popularity: Zeo Inc. gave me a free set of headbands (worth ~$76.18$502012) because they liked my Zeo self-experiments, a software engineer/manager contacted me to see about recruiting me, ThinkGum offered me some of their eponymous product for my Nootropics page, and my request for Bitcoin donations has paid off a little with a few donations $3.71₿0.12011–$37.11₿12011 and one generous donation of $742.27₿202011 (worth a bit upwards of $152.36$1002012 at the time; I spent it on modafinil). (This is all intrinsically helpful but I value it mostly because money speaks louder than words.)
Promotion: Late 2011
I’ve done relatively little in this period compared with the previous period:
I abandoned Witcoin not long after my experiment with it; and now Witcoin is dead, pending a possible open-sourcing of the codebase.
My AdWords credit is mostly expired. For some reason, my click-through rates kept dropping.
StumbleUpon remains a good traffic source (1,430 visits). I continue to ‘stumble’ my new articles when I remember to do so.
Hacker News was responsible for a great deal of my traffic in this period (4,175 visits). Most of it was not my doing, however—whenever I submit links, they do poorly.
LessWrong remains a major traffic driver (6,961 visits); I continue to see a lot of referrals from old posts and comments. Nor do all the links seem to be perceived negatively or as self-promotion by the LW community: I posted an article describing site updates and the article was received well to my surprise, eliciting very favorable reviews of my writings in general. That was nice.
For this period, I did spend a little more effort submitting stuff to Reddit; and I was handsomely rewarded with the Silk Road submission skyrocketing and become one of the all-time most popular articles in the Bitcoin subreddit. Between that and my nootropics articles, Reddit sent me 20,842 visits.
The largest traffic sources are Google at 36,625 visits and direct/no-referrals at 24,118 visits. As I have no idea how to improve these two figures, I ignore it. I write good content, submit it places, supply metadata, and abide by my hackerly principles; I hope that that is all the SEO I need.
February 2011–July 2011
darcs-graph for this period:

Plot of patch creations (y-axis) versus date (x-axis): Repository creation to July
Traffic: Early 2011
Streaming in the wind
the smoke from Fuji
vanishes in the sky;
I know not where
these thoughts of mine go, either.the monk Saigyô (Shin Kokin Wakashu XVII: #1615)
Google Analytics reports that over the 124 days between 2011-02-28 and 2011-07-02, there were 42,410 page-views (average 342/day):

Plot of page-hits (y-axis) versus date (x-axis)
The most popular pages ranking changed considerably; while the DNB FAQ maintained its pre-eminent popularity, 3 new pages bumped out ‘Links’, ‘Spaced repetition’, ‘The Melancholy of Kyon’, and ‘Haskell Summer of Code’. I am a little surprised that my 2 Death Note essays seemed to’ve struck a chord, and even more surprised that my sloppy & random & un-rigorous notes about nootropics would be consistently popular:
DNB FAQ: 10,406
home/main page: 4,189
Modafinil: 3,231
Death Note’s Ending: 1,779
Death Note Anonymity: 1,366
Nootropics: 2,056
Archiving GitHub: 706
Promotion: Early 2011
They accumulate
but there are none to buy them—
these leaves of words
piling up like wares for sale
beneath the Sumiyoshi Pine.Shōtetsu; (#180, “Famous Market Town”, Unforgotten Dreams; trans. Steven D. Carter)5
As a writer, I desire feedback. I also want to feel that my work has been of use to people. So while it would be nice if the world beat a path to my website, I recognize that I have to put some effort into marketing my work. I’ve tried a number of methods.
Witcoin: I submitted any number of fairly popular articles but my total Witcoin traffic over this period was 132 visits—a traffic total I could have gotten with one slightly popular link on Reddit or a few links in comments. While I didn’t lose any Bitcoins (because my registration was funded by Kiba’s donation of $37.11₿12011 and actually profited $102.8₿2.772011), I have spent at least 6 hours figuring out how to use Witcoin, submitting articles, responding to comments, and voting. Not the best use of time.
Google AdWords: if one is willing to spend traffic on ads to get money, at the right price, you should be willing to spend money on ads to get traffic too; since it was free, I gave it a try.
The ads were initially disappointing, with after 3010 impression, there were still no clicks! It was funded by the $155.26$1002011 coupon for signing up for Google’s Webmaster Tools. Interface is decent given complexity of task, but deeply frustrating to have to wait many weeks for the DNB FAQ and Modafinil ads to be approved or rejected. Finally, almost in June, the DNB FAQ ads were approved and the modafinil ads rejected. From 23 March to 2011-07-02, I paid $32.71$21.072011 for 98,900 impressions yielding 63 clicks through. (Those visitors only spent an average of <1.5 minutes on the site, too.) Again, not a great investment of time.
Even without the approval issues, I ran into issues in targeting any ads. For some of my pages, like on modafinil, there are probably a lot of searchers/readers who might want to be linked to it, but Google bans most nootropic-related ads as part of general anti-drug/pharmacy policy, so no dice there. For other pages, I already rank too highly in the Google search for ads to be worthwhile. For most pages, I couldn’t think of queries worth targeting. And while perhaps banner ads on random pages would be better to target, creating images is quite difficult and costly in terms of time & effort. So I gave up on that idea.
Organic growth & linking seems to be the way to go. People who want ‘interesting content in general’ will be reading Reddit or HN, not googling it.
StumbleUpon: with just 3 articles ‘stumbled’ (included in the database), specifically DNB FAQ, In Defense Of Inclusionism & Nootropics, StumbleUpon was responsible for 161 visits or 2.77% of all traffic in the period I looked at. How much traffic could I expect with 30 or 40 articles stumbled? Quite a bit. SU has no ‘front page’ like other social news aggregators so traffic is more of a trickle than flood; nevertheless, “Death Note Ending” clicked with SU readers and I got >500 readers out of it in a day or two. In total over this time, SU drove 2,257 visits. SU tended to give a pretty steady 30–50 visits a day with rare spikes when an article clicked. The downside is that after looking at SU comments and at how much time they spend on pages6, I have to agree with Arvind Narayanan’s “StumbleUpon Considered Harmful”—SUers do not want quality content but quick content, for the dopamine boost.
Hacker News: “Girl Scouts and good governance” made it to the front page, resulting in 1,727 visits & setting Gwern.net traffic records (it is that giant spike in the traffic graph), but apparently minimal viewing of other pages. Further, while I seem to get a modest amount of Reddit traffic from even unsuccessful submissions, HN submissions will sink without a trace. Kiba calls Hacker News a ‘lottery’, but it seems to be one worth playing.
LessWrong is a natural place to post many of my writings. And perhaps unsurprisingly, LW is my second-largest source of traffic, coming in after SU with 1,857 visits. While few of my submissions get upvoted all that highly, most of them drove a fair amount of traffic even in the Discussion ghetto. (Linking in comments also drives a surprising amount of traffic over long periods to my practical articles like on n-back or melatonin.) At some point I hope to have a good Article and see how much of a disparity there is.
2010
October 2010–February 2011
My editing activity, as generated by darcs-graph:

Plot of patch creations (y-axis) versus date (x-axis): October to February
Traffic: Late 2010
An audience, even an audience of one, is always to be treasured and respected.
Adalric Brandl (“Uhl Eharl Khoehng”, Patricia A. Jackson)
Popularity-wise, Google Analytics reports that over the 150 days between 2010-10-01 and 2011-02-28, there were 4,346 page-views (average 30/day):

Plot of page-hits (y-axis) versus date (x-axis)
The most popular pages were7:
DNB FAQ: 1,180
Modafinil: 644
Spaced repetition: 101
Links: 96
The rankings are not as I would prefer (I imagine Internet archivist Jason Scott Sadofsky feels much the same way about Sockington), but it’s pretty clear that people enjoy my more practical articles the most.
Of writing Last Tales after 3 spinal surgeries (pg161–162 of Images Of Truth: Remembrances And Criticism, Wescott 196264ya)↩︎
I rewrote the script a little to use the nicer plots of ggplot2 and switches to LOESS for the smoothed curve:
↩︎start <- as.Date("2023-01-02") end <- as.Date("2023-07-01") patches <- as.Date(system(paste0("git --git-dir=/home/gwern/wiki/.git/ log --after=", start, " --before=", end, " --format='%ad' --date=short master"), intern=TRUE)) patchFrame <- aggregate( patches , by = list(patches) , length ) days <- seq(start, end, "day") dayFrame <- aggregate( days , by = list(days) , length ) bar <- rbind(dayFrame, patchFrame) all <- aggregate(bar$x, by=list(bar$Group.1), FUN=function (x) { sum(as.vector(x));}) png(file="~/wiki/doc/traffic/2023-gwern-july-git-history.png", width = 1400, height = 698) library(ggplot2) qplot(Group.1, x, data=all) + theme_bw(base_size=20) + xlab("Date (2023)") + ylab("Patch count") + theme(legend.title=element_blank()) + stat_smooth() invisible(dev.off())Since I converted the repo to use git,
darcs-graphwas no longer available, so I wrote my own script in R using splines rather than a 7-day moving average:↩︎start <- as.Date("2014-01-02") end <- as.Date("2014-07-02") patches <- as.Date(system(paste0("git log --after=", start, " --before=", end, " --format='%ad' --date=short master"), intern=TRUE)) patchFrame <- aggregate( patches , by = list(patches) , length ) days <- seq(start, end, "day") dayFrame <- aggregate( days , by = list(days) , length ) bar <- rbind(dayFrame, patchFrame) all <- aggregate(bar$x, by=list(bar$Group.1), FUN=function (x) { sum(as.vector(x));}) plot(x ~ Group.1, data=all, xlab="Date (Jan--July 2014)", ylab="gwern.net daily patches") library(splines); lines(predict(interpSpline(days, all$x)))It ultimately fell through as O’Reilly decided the QS moment had passed, and killed the series.↩︎
I am sometimes reminded of another waka, by Ikkyu:
↩︎To write something and leave it behind us,
Is but a dream.
When we awake we know
There is not even anyone to read it.They spend an average of 27 seconds; in comparison, my second largest source of traffic, LessWrongers, average 3 minutes and 29 seconds; even my third largest traffic source, Redditers, manage almost 2 minutes. Even random people coming from Google manage to spend 44 seconds on their visit!↩︎
Anecdotally, the rankings seem correct. When I went to a LessWrong meetup in California, many knew of or had read the DNB FAQ, some had read or used my modafinil price-chart, and few remembered reading anything else.↩︎