The Replication Crisis: Flaws in Mainstream Science
2013 discussion of how systemic biases in science, particularly medicine and psychology, have resulted in a research literature filled with false positives and exaggerated effects, called ‘the Replication Crisis’.
Long-standing problems in standard scientific methodology have exploded as the “Replication Crisis”: the discovery that many results in fields as diverse as psychology, economics, medicine, biology, and sociology are in fact false or quantitatively highly inaccurately measured. I cover here a handful of the issues and publications on this large, important, and rapidly developing topic up to about 201313ya, at which point the Replication Crisis became too large a topic to cover more than cursorily.
The crisis is caused by methods & publishing procedures which interpret random noise as important results, far too small datasets, selective analysis by an analyst trying to reach expected/desired results, publication bias, poor implementation of existing best-practices, nontrivial levels of research fraud, software errors, philosophical beliefs among researchers that false positives are acceptable, neglect of known confounding like genetics, and skewed incentives (financial & professional) to publish ‘hot’ results.
Thus, any individual piece of research typically establishes little. Scientific validation comes not from small p-values, but from discovering a regular feature of the world which disinterested third parties can discover with straightforward research done independently on new data with new procedures—replication.
Mainstream science is flawed: seriously mistaken statistics combined with poor incentives has led to masses of misleading research. Not that this problem is exclusive to psychology—economics, certain genetics subfields (principally candidate-gene research), biomedical science, and biology in general are often on shaky ground.
NHST and Systematic Biases
Statistical background on p-value problems: Against null-hypothesis statistical-significance testing
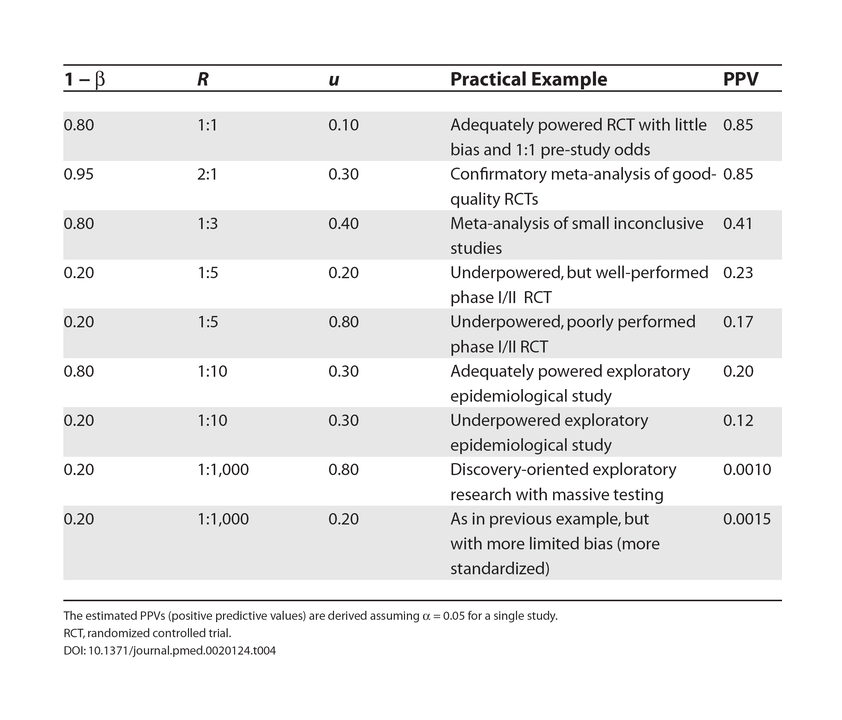
The basic nature of ‘significance’ being usually defined as p < 0.05 means we should expect something like >5% of studies or experiments to be bogus (optimistically), but that only considers “false positives”; reducing “false negatives” requires statistical power (weakened by small samples), and the two combine with the base rate of true underlying effects into a total error rate. Ioannidis 2005 points out that considering the usual p values, the underpowered nature of many studies, the rarity of underlying effects, and a little bias, even large randomized trials may wind up with only an 85% chance of having yielded the truth. One survey of reported p-values in medicine yielding a lower bound of false positives of 17%.
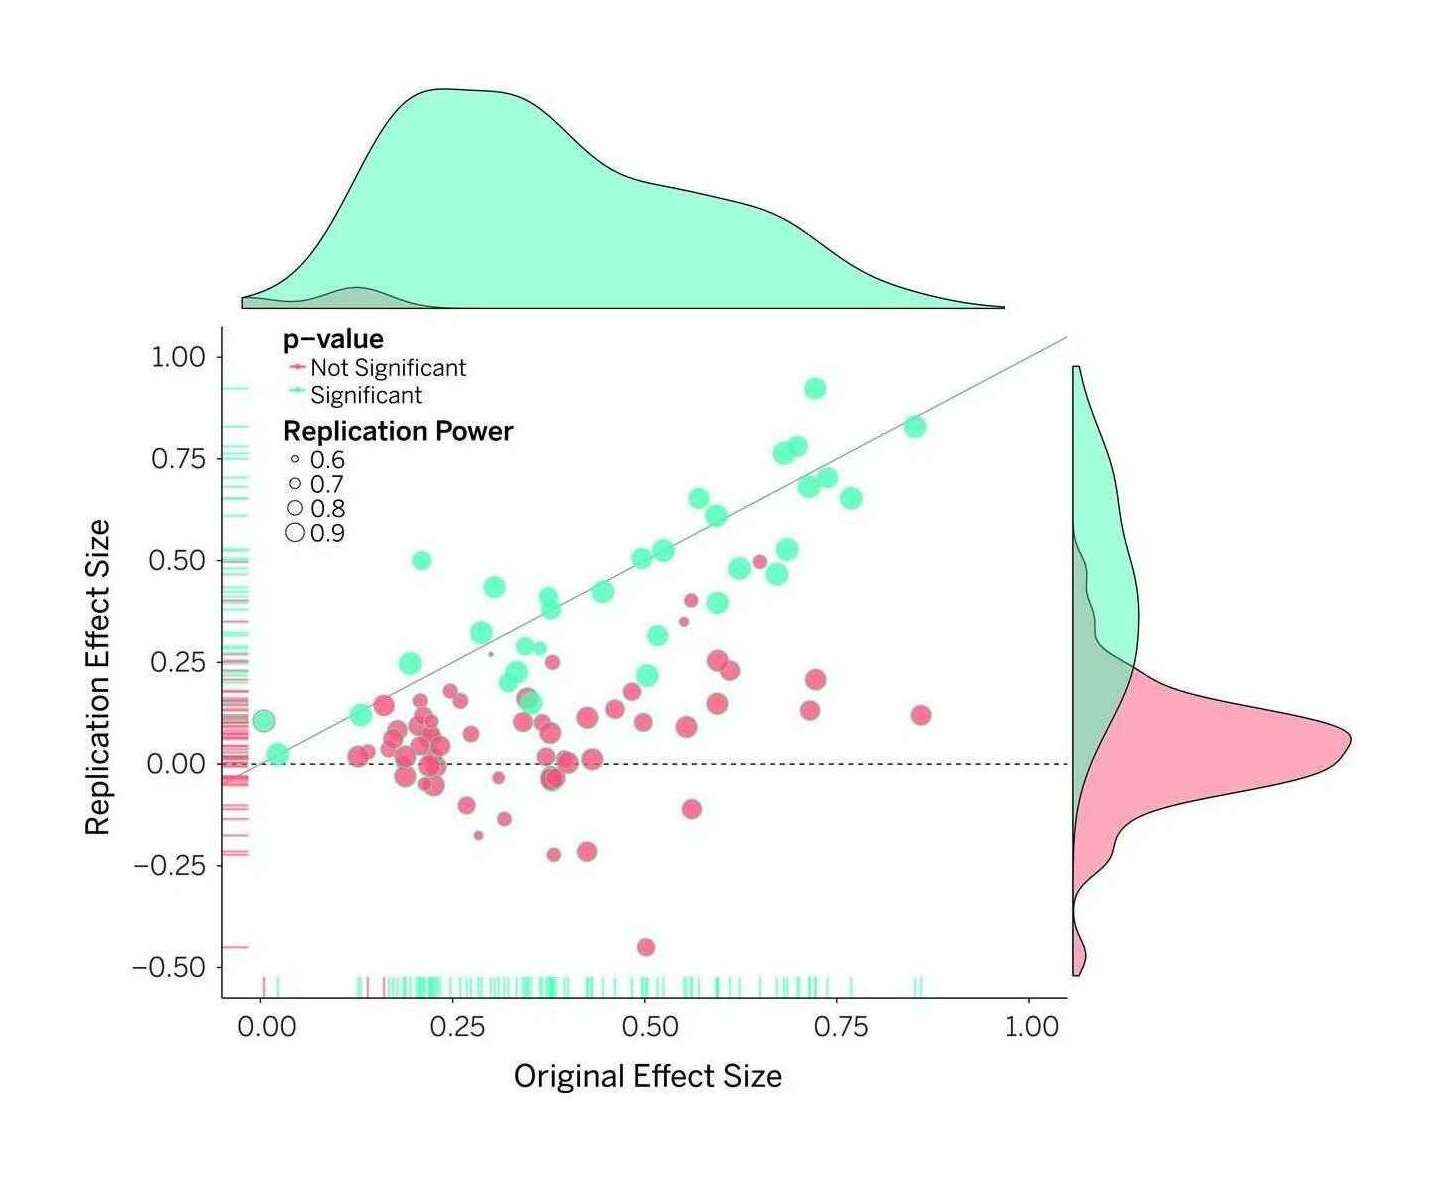
Open Science Collaboration 2015: “Figure 1: Original study effect size versus replication effect size (correlation coefficients). Diagonal line represents replication effect size equal to original effect size. Dotted line represents replication effect size of 0. Points below the dotted line were effects in the opposite direction of the original. Density plots are separated by statistically-significant (blue) and non-statistically-significant (red) effects.”
Yet, there are too many positive results1 (psychiatry, neurobiology biomedicine, biology, ecology & evolution, psychology 12 3 4 5, economics’ top journals, sociology, gene-disease correlations) given effect sizes (and positive results correlate with per capita publishing rates in US states & vary by period & country—apparently chance is kind to scientists who must publish a lot and recently!); then there come the inadvertent errors which might cause retraction, which is rare, but the true retraction rate may be 0.1–1% (“How many scientific papers should be retracted?”), is increasing & seems to positively correlate with journal prestige metrics (modulo the confounding factor that famous papers/journals get more scrutiny), not that anyone pays any attention to such things; then there are basic statistical errors in >11% of papers (based on the high-quality papers in Nature and the British Medical Journal; “Incongruence between test statistics and P values in medical papers”, García-Berthou 200422ya) or 50% in neuroscience.
And only then can we get into replicating at all. See for example The Atlantic article “Lies, Damned Lies, and Medical Science” on John P. A. Ioannidis’s research showing 41% of the most cited medical research failed to be replicated—were wrong. For details, you can see Ioannidis’s “Why Most Published Research Findings Are False”2, or Begley’s failed attempts to replicate 47 of 53 articles on top cancer journals (leading to Booth’s “Begley’s Six Rules”; see also the Nature Biotechnology editorial & note that full details have not been published because the researchers of the original studies demanded secrecy from Begley’s team), or Kumar & Nash 2011’s “Health Care Myth Busters: Is There a High Degree of Scientific Certainty in Modern Medicine?” who write ‘We could accurately say, “Half of what physicians do is wrong,” or “Less than 20% of what physicians do has solid research to support it.”’ Nutritional epidemiology is something of a fish in a barrel; after Ioannidis, is anyone surprised that when Young & Karr 2011 followed up on 52 correlations tested in 12 RCTs, 0⁄52 replicated and the RCTs found the opposite of 5?
Attempts to use animal models to infer anything about humans suffer from all the methodological problems previously mentioned, and add in interesting new forms of error such as mice simply being irrelevant to humans, leading to cases like <150 sepsis clinical trials all failing—because the drugs worked in mice but humans have a completely different set of genetic reactions to inflammation.
‘Hot’ fields tend to be new fields, which brings problems of its own, see “Large-Scale Assessment of the Effect of Popularity on the Reliability of Research” & discussion. (Failure to replicate in larger studies seems to be a hallmark of biological/medical research. Ioannidis performs the same trick with biomarkers, finding less than half of the most-cited biomarkers were even statistically-significant in the larger studies. 12 of the more prominent SNP-IQ correlations failed to replicate on a larger data.) As we know now, almost the entire candidate-gene literature, most things reported from 2000–10201016ya before large-scale GWASes started to be done (and completely failing to find the candidate-genes), is nothing but false positives! The replication rates of candidate-genes for things like intelligence, personality, gene-environment interactions, psychiatric disorders–the whole schmeer—are literally ~0%. On the plus side, the parlous state of affairs means that there are some cheap heuristics for detecting unreliable papers—simply asking for data & being refused/ignored correlates strongly with the original paper having errors in its statistics.
This epidemic of false positives is apparently deliberately and knowing accepted by epidemiology; Young’s 200818ya “Everything is Dangerous” remarks that 80–90% of epidemiology’s claims do not replicate (eg. the NIH ran 20 randomized-controlled-trials of claims, and only 1 replicated) and that lack of ‘multiple comparisons’ (either Bonferroni or Benjamin-Hochberg) is taught: “Rothman (199036ya) says no correction for multiple testing is necessary and Vandenbroucke, PLoS Med (200818ya) agrees” (see also Perneger 1998 who also explicitly understands that no correction increases type 2 errors and reduces type 1 errors). Multiple correction is necessary because its absence does, in fact, result in the overstatement of medical benefit (Godfrey 1985, Pocock et al 1987, Smith 1987). The average effect size for findings confirmed meta-analytically in psychology/education is d = 0.53 (well below several effect sizes from n-back/IQ studies); when moving from laboratory to non-laboratory settings, meta-analyses replicate findings correlate ~0.7 of the time, but for social psychology the replication correlation falls to ~0.5 with >14% of findings actually turning out to be the opposite (see Anderson et al 1999 and Mitchell 2012; for exaggeration due to non-blinding or poor randomization, Wood et al 2008). (Meta-analyses also give us a starting point for understanding how unusual medium or large effects sizes are4.) Psychology does have many challenges, but practitioners also handicap themselves; an older overview is the entertaining “What’s Wrong With Psychology, Anyway?”, which mentions the obvious point that statistics & experimental design are flexible enough to reach significance as desired. In an interesting example of how methodological reforms are no panacea in the presence of continued perverse incentives, an earlier methodological improvement in psychology (reporting multiple experiments in a single publication as a check against results not being generalizable) has merely demonstrated the widespread p-value hacking or manipulation or publication bias when one notes that given the low statistical power of each experiment, even if the underlying phenomena were real it would still be wildly improbable that all n experiments in a paper would turn up statistically-significant results, since power is usually extremely low in experiments (eg. in neuroscience, “between 20–30%”). These problems are pervasive enough that I believe they entirely explain any “decline effects”5.
The failures to replicate “statistically-significant” results has led one blogger to caustically remark (see also “Parapsychology: the control group for science”, “Using degrees of freedom to change the past for fun and profit”, “The Control Group is Out Of Control”):
Parapsychology, the control group for science, would seem to be a thriving field with “statistically-significant” results aplenty…Parapsychologists are constantly protesting that they are playing by all the standard scientific rules, and yet their results are being ignored—that they are unfairly being held to higher standards than everyone else. I’m willing to believe that. It just means that the standard statistical methods of science are so weak and flawed as to permit a field of study to sustain itself in the complete absence of any subject matter. With two-thirds of medical studies in prestigious journals failing to replicate, getting rid of the entire actual subject matter would shrink the field by only 33%.
…Let me draw the moral [about publication bias]. Even if the community of inquiry is both too clueless to make any contact with reality and too honest to nudge borderline findings into significance, so long as they can keep coming up with new phenomena to look for, the mechanism of the file-drawer problem alone will guarantee a steady stream of new results. There is, so far as I know, no Journal of Evidence-Based Haruspicy filled, issue after issue, with methodologically-faultless papers reporting the ability of sheep’s livers to predict the winners of sumo championships, the outcome of speed dates, or real estate trends in selected suburbs of Chicago. But the difficulty can only be that the evidence-based haruspices aren’t trying hard enough, and some friendly rivalry with the plastromancers is called for. It’s true that none of these findings will last forever, but this constant overturning of old ideas by new discoveries is just part of what makes this such a dynamic time in the field of haruspicy. Many scholars will even tell you that their favorite part of being a haruspex is the frequency with which a new sacrifice over-turns everything they thought they knew about reading the future from a sheep’s liver! We are very excited about the renewed interest on the part of policy-makers in the recommendations of the mantic arts…
And this is when there is enough information to replicate; open access to any data for a paper is rare (economics: <10%) the economics journal Journal of Money, Credit and Banking, which required researchers provide the data & software which could replicate their statistical analyses, discovered that <10% of the submitted materials were adequate for repeating the paper (see “Lessons from the JMCB Archive”). In one cute economics example, replication failed because the dataset had been heavily edited to make participants look better (for more economics-specific critique, see Ioannidis & Doucouliagos 2013). Availability of data, often low, decreases with time, and many studies never get published regardless of whether publication is legally mandated.
Transcription errors in papers seem to be common (possibly due to constantly changing analyses & p-hacking?), and as software and large datasets becomes more inherent to research, the need and the problem of it being possible to replicate will get worse because even mature commercial software libraries can disagree majorly on their computed results to the same mathematical specification (see also Anda et al 2009). And spreadsheets are especially bad, with error rates in the 88% range (“What we know about spreadsheet errors”, Panko 199828ya); spreadsheets are used in all areas of science, including biology and medicine (see “Error! What biomedical computing can learn from its mistakes”; famous examples of coding errors include Donohue-Levitt & Reinhart-Rogoff), not to mention regular business (eg. the London Whale).
Psychology is far from being perfect either; look at the examples in The New Yorker’s “The Truth Wears Off” article. Computer scientist Peter Norvig has written a must-read essay on interpreting statistics, “Warning Signs in Experimental Design and Interpretation”; a number of warning signs apply to many psychological studies. There may be incentive problems: a transplant researcher discovered the only way to publish in Nature his inability to replicate his earlier Nature paper was to officially retract it; another interesting example is when, after Daryl Bem got a paper published in the top journal JPSP demonstrating precognition, the journal refused to publish any replications (failed or successful) because… “‘We don’t want to be the Journal of Bem Replication’, he says, pointing out that other high-profile journals have similar policies of publishing only the best original research.” (Quoted in New Scientist) One doesn’t need to be a genius to understand why psychologist Andrew D. Wilson might snarkily remark “…think about the message JPSP is sending to authors. That message is ‘we will publish your crazy story if it’s new, but not your sensible story if it’s merely a replication’.” (You get what you pay for.) In one large test of the most famous psychology results, 10 of 13 (77%) replicated. The replication rate is under 1⁄3 in one area of psychology touching on genetics. This despite the simple point that replications reduce the risk of publication bias, and increase statistical power, so that a replicated result is more likely to be true. And the small samples of n-back studies and nootropic chemicals are especially problematic. Quoting from Nick Bostrom & Anders Sandberg’s 200620ya “Converging Cognitive Enhancements”:
The reliability of research is also an issue. Many of the cognition-enhancing interventions show small effect sizes, which may necessitate very large epidemiological studies possibly exposing large groups to unforeseen risks.
Particularly troubling is the slowdown in drug discovery & medical technology during the 2000s, even as genetics in particular was expected to produce earth-shaking new treatments. One biotech venture capitalist writes:
The company spent $7.76$52011M or so trying to validate a platform that didn’t exist. When they tried to directly repeat the academic founder’s data, it never worked. Upon re-examination of the lab notebooks, it was clear the founder’s lab had at the very least massaged the data and shaped it to fit their hypothesis. Essentially, they systematically ignored every piece of negative data. Sadly this “failure to repeat” happens more often than we’d like to believe. It has happened to us at Atlas [Venture] several times in the past decade…The unspoken rule is that at least 50% of the studies published even in top tier academic journals—Science, Nature, Cell, PNAS, etc..—can’t be repeated with the same conclusions by an industrial lab. In particular, key animal models often don’t reproduce. This 50% failure rate isn’t a data free assertion: it’s backed up by dozens of experienced R&D professionals who’ve participated in the (re)testing of academic findings. This is a huge problem for translational research and one that won’t go away until we address it head on.
Half the respondents to a 201214ya survey at one cancer research center reported 1 or more incidents where they could not reproduce published research; two-thirds of those were unable to “ever able to explain or resolve their discrepant findings”, half had trouble publishing results contradicting previous publications, and two-thirds failed to publish contradictory results. An internal Bayer survey of 67 projects (commentary) found that “only in ~20–25% of the projects were the relevant published data completely in line with our in-house findings”, and as far as assessing the projects went:
…despite the low numbers, there was no apparent difference between the different research fields. Surprisingly, even publications in prestigious journals or from several independent groups did not ensure reproducibility. Indeed, our analysis revealed that the reproducibility of published data did not significantly correlate with journal impact factors, the number of publications on the respective target or the number of independent groups that authored the publications. Our findings are mirrored by ‘gut feelings’ expressed in personal communications with scientists from academia or other companies, as well as published observations. [apropos of above] An unspoken rule among early-stage venture capital firms that “at least 50% of published studies, even those in top-tier academic journals, can’t be repeated with the same conclusions by an industrial lab” has been recently reported (see Further information) and discussed 4.
Physics has relatively small sins; “Assessing uncertainty in physical constants” (Henrion & Fischoff 198541ya); Hanson’s summary:
Looking at 306 estimates for particle properties, 7% were outside of a 98% confidence interval (where only 2% should be). In seven other cases, each with 14 to 40 estimates, the fraction outside the 98% confidence interval ranged from 7% to 57%, with a median of 14%.
Nor is peer review reliable or robust against even low levels of collusion. Scientists who win the Nobel Prize find their other work suddenly being heavily cited, suggesting either that the community either badly failed in recognizing the work’s true value or that they are now sucking up & attempting to look better by association. (A mathematician once told me that often, to boost a paper’s acceptance chance, they would add citations to papers by the journal’s editors—a practice that will surprise none familiar with Goodhart’s law and the use of citations in tenure & grants.)
The former editor Richard Smith amusingly recounts his doubts about the merits of peer review as practiced, and physicist Michael Nielsen points out that peer review is historically rare (just one of Einstein’s 300 papers was peer reviewed; the famous Nature did not institute peer review until 196759ya), has been poorly studied & not shown to be effective, is nationally biased, erroneously rejects many historic discoveries (one study lists “34 Nobel Laureates whose awarded work was rejected by peer review”; Horrobin 1990 lists other), and catches only a small fraction of errors. And questionable choices or fraud? Forget about it:
A pooled weighted average of 1.97% (n = 7, 95%CI: 0.86–4.45) of scientists admitted to have fabricated, falsified or modified data or results at least once—a serious form of misconduct by any standard—and up to 33.7% admitted other questionable research practices. In surveys asking about the behavior of colleagues, admission rates were 14.12% (n = 12, 95% CI: 9.91–19.72) for falsification, and up to 72% for other questionable research practices…When these factors were controlled for, misconduct was reported more frequently by medical/pharmacological researchers than others.
And psychologists:
We surveyed over 2,000 psychologists about their involvement in questionable research practices, using an anonymous elicitation format supplemented by incentives for honest reporting. The impact of incentives on admission rates was positive, and greater for practices that respondents judge to be less defensible. Using three different estimation methods, we find that the proportion of respondents that have engaged in these practices is surprisingly high relative to respondents’ own estimates of these proportions. Some questionable practices may constitute the prevailing research norm.
In short, the secret sauce of science is not ‘peer review’. It is replication!
Systemic Error Doesn’t Go Away
Far better an approximate answer to the right question, which is often vague, than an exact answer to the wrong question, which can always be made precise.
Why isn’t the solution as simple as eliminating datamining by methods like larger n or pre-registered analyses? Because once we have eliminated the random error in our analysis, we are still left with a (potentially arbitrarily large) systematic error, leaving us with a large total error.
None of these systematic problems should be considered minor or methodological quibbling or foolish idealism: they are systematic biases and as such, they force an upper bound on how accurate a corpus of studies can be even if there were thousands upon thousands of studies, because the total error in the results is made up of random error and systematic error, but while random error shrinks as more studies are done, systematic error remains the same.
A thousand biased studies merely result in an extremely precise estimate of the wrong number.
This is a point appreciated by statisticians and experimental physicists, but it doesn’t seem to be frequently discussed. Andrew Gelman has a fun demonstration of selection bias involving candy, or from pg812–1020 of Chapter 8 “Sufficiency, Ancillarity, And All That” of Probability Theory: The Logic of Science by E.T. Jaynes:
The classical example showing the error of this kind of reasoning is the fable about the height of the Emperor of China. Supposing that each person in China surely knows the height of the Emperor to an accuracy of at least ±1 meter, if there are N = 1,000,000,000 inhabitants, then it seems that we could determine his height to an accuracy at least as good as
(8-49)
merely by asking each person’s opinion and averaging the results.
The absurdity of the conclusion tells us rather forcefully that the √N rule is not always valid, even when the separate data values are causally independent; it requires them to be logically independent. In this case, we know that the vast majority of the inhabitants of China have never seen the Emperor; yet they have been discussing the Emperor among themselves and some kind of mental image of him has evolved as folklore. Then knowledge of the answer given by one does tell us something about the answer likely to be given by another, so they are not logically independent. Indeed, folklore has almost surely generated a systematic error, which survives the averaging; thus the above estimate would tell us something about the folklore, but almost nothing about the Emperor.
We could put it roughly as follows:
error in estimate = (8-50)
where S is the common systematic error in each datum, R is the RMS ‘random’ error in the individual data values. Uninformed opinions, even though they may agree well among themselves, are nearly worthless as evidence. Therefore sound scientific inference demands that, when this is a possibility, we use a form of probability theory (ie. a probabilistic model) which is sophisticated enough to detect this situation and make allowances for it.
As a start on this, equation (8-50) gives us a crude but useful rule of thumb; it shows that, unless we know that the systematic error is less than about 1⁄3 of the random error, we cannot be sure that the average of a million data values is any more accurate or reliable than the average of ten6. As Henri Poincaré put it: “The physicist is persuaded that one good measurement is worth many bad ones.” This has been well recognized by experimental physicists for generations; but warnings about it are conspicuously missing in the “soft” sciences whose practitioners are educated from those textbooks.
Or pg1019–1020 Chapter 10 “Physics of ‘Random Experiments’”:
…Nevertheless, the existence of such a strong connection is clearly only an ideal limiting case unlikely to be realized in any real application. For this reason, the law of large numbers and limit theorems of probability theory can be grossly misleading to a scientist or engineer who naively supposes them to be experimental facts, and tries to interpret them literally in his problems. Here are two simple examples:
Suppose there is some random experiment in which you assign a probability p for some particular outcome A. It is important to estimate accurately the fraction f of times A will be true in the next million trials. If you try to use the laws of large numbers, it will tell you various things about f; for example, that it is quite likely to differ from p by less than a tenth of one percent, and enormously unlikely to differ from p by more than one percent. But now, imagine that in the first hundred trials, the observed frequency of A turned out to be entirely different from p. Would this lead you to suspect that something was wrong, and revise your probability assignment for the 101’st trial? If it would, then your state of knowledge is different from that required for the validity of the law of large numbers. You are not sure of the independence of different trials, and/or you are not sure of the correctness of the numerical value of p. Your prediction of f for a million trials is probably no more reliable than for a hundred.
The common sense of a good experimental scientist tells him the same thing without any probability theory. Suppose someone is measuring the velocity of light. After making allowances for the known systematic errors, he could calculate a probability distribution for the various other errors, based on the noise level in his electronics, vibration amplitudes, etc. At this point, a naive application of the law of large numbers might lead him to think that he can add three significant figures to his measurement merely by repeating it a million times and averaging the results. But, of course, what he would actually do is to repeat some unknown systematic error a million times. It is idle to repeat a physical measurement an enormous number of times in the hope that “good statistics” will average out your errors, because we cannot know the full systematic error. This is the old “Emperor of China” fallacy…
Indeed, unless we know that all sources of systematic error—recognized or unrecognized—contribute less than about one-third the total error, we cannot be sure that the average of a million measurements is any more reliable than the average of ten. Our time is much better spent in designing a new experiment which will give a lower probable error per trial. As Poincaré put it, “The physicist is persuaded that one good measurement is worth many bad ones.”7 In other words, the common sense of a scientist tells him that the probabilities he assigns to various errors do not have a strong connection with frequencies, and that methods of inference which presuppose such a connection could be disastrously misleading in his problems.
Schlaifer much earlier made the same point in Probability and Statistics for Business Decisions: an Introduction to Managerial Economics Under Uncertainty, Schlaifer 1959, pg488–489 (see also Meng 2018/Shirani-Mehr et al 2018):
31.4.3 Bias and Sample Size
In §31.2.6 we used a hypothetical example to illustrate the implications of the fact that the variance of the mean of a sample in which bias is suspected is
so that only the second term decreases as the sample size increases and the total can never be less than the fixed value of the first term. To emphasize the importance of this point by a real example we recall the most famous sampling fiasco in history, the presidential poll conducted by the Literary Digest in 1936. Over 2 million registered voters filled in and returned the straw ballots sent out by the Digest, so that there was less than one chance in 1 billion of a sampling error as large as 2⁄10 of one percentage point8, and yet the poll was actually off by nearly 18 percentage points: it predicted that 54.5 per cent of the popular vote would go to Landon, who in fact received only 36.7 per cent.9 10
Since sampling error cannot account for any appreciable part of the 18-point discrepancy, it is virtually all actual bias. A part of this total bias may be measurement bias due to the fact that not all people voted as they said they would vote; the implications of this possibility were discussed in §31.3. The larger part of the total bias, however, was almost certainly selection bias. The straw ballots were mailed to people whose names were selected from lists of owners of telephones and automobiles and the subpopulation which was effectively sampled was even more restricted than this: it consisted only of those owners of telephones and automobiles who were willing to fill out and return a straw ballot. The true mean of this subpopulation proved to be entirely different from the true mean of the population of all United States citizens who voted in 193690ya.
It is true that there was no evidence at the time this poll was planned which would have suggested that the bias would be as great as the 18 percentage points actually realized, but experience with previous polls had shown biases which would have led any sensible person to assign to a distribution with equal to at least 1 percentage point. A sample of only 23,760 returned ballots, one 1⁄100th the size actually used, would have given a value of only 1⁄3 percentage point, so that the standard deviation of x would have been
percentage points. Using a sample 100 times this large reduced σ(ε) from 1⁄3 point to virtually zero, but it could not affect and thus on the most favorable assumption could reduce σ(x) only from 1.05 points to 1 point. To collect and tabulate over 2 million additional ballots when this was the greatest gain that could be hoped for was obviously ridiculous before the fact and not just in the light of hindsight.
What’s particularly sad is when people read something like this and decide to rely on anecdotes, personal experiments, and alternative medicine where there are even more systematic errors and no way of reducing random error at all! Science may be the lens that sees its own flaws, but if other epistemologies do not boast such long detailed self-critiques, it’s not because they are flawless… It’s like that old Jamie Zawinski quote: Some people, when faced with the problem of mainstream medicine & epidemiology having serious methodological weaknesses, say “I know, I’ll turn to non-mainstream medicine & epidemiology. After all, if only some medicine is based on real scientific method and outperforms placebos, why bother?” (Now they have two problems.) Or perhaps Isaac Asimov: “John, when people thought the earth was flat, they were wrong. When people thought the earth was spherical, they were wrong. But if you think that thinking the earth is spherical is just as wrong as thinking the earth is flat, then your view is wronger than both of them put together.”
See Also
Why Correlation Usually ≠ Causation: Causal Nets Cause Common Confounding
Questionable Research Findings:
Appendix
Additional Links
A bibliography of additional links to papers/blogs/articles on the Replication Crisis, primarily post-2013 and curated from my newsletter, as a followup to the main article text describing the Replication Crisis.
blogs:
blood sugar/willpower: “An opportunity cost model of subjective effort and task performance”, Kurzban et al 201313ya; “A Meta-Analysis of Blood Glucose Effects on Human Decision Making”, Orquin & Kurzban 2016; “Is Ego-Depletion a Replicable Effect? A Forensic Meta-Analysis of 165 Ego Depletion Articles”; “Eyes wide shut or eyes wide open?”, Roberts commentary; “Ego depletion may disappear by 2020”, Vadillo 2019; “A Multisite Preregistered Paradigmatic Test of the Ego-Depletion Effect”, Vohs et al 2021
“Romance, Risk, and Replication: Can Consumer Choices and Risk-Taking be Primed by Mating Motives?”, Shakes et al 2015
“Do Certain Countries Produce Only Positive Results? A Systematic Review of Controlled Trials”, Vickers et al 1998
“Why do Phase III Trials of Promising Heart Failure Drugs Often Fail? The Contribution of ‘Regression to the Truth’”, Krum & Tonkin 2003
“Randomized Controlled Trials Commissioned by the Institute of Education Sciences Since 200224ya: How Many Found Positive Versus Weak or No Effects?”, Coalition for Evidence-Based Policy 2013
“Theory-testing in psychology and physics: a methodological paradox”, Meehl 1967
“Non-industry-Sponsored Preclinical Studies on Statins Yield Greater Efficacy Estimates Than Industry-Sponsored Studies: A Meta-Analysis”, Krauth et al 2014
“If correlation doesn’t imply causation, then what does?”, Michael Nielsen
“Teachers and Income: What Did the Project STAR Kindergarten Study Really Find?”
“Deep impact: unintended consequences of journal rank”, Brembs et al 201313ya (meta-science)
“Personal reflections on lessons learned from randomized trials involving newborn infants, 1951–16196759ya”, Silverman 2003
“Publication bias in the social sciences: Unlocking the file drawer”, Franco et al 201412ya (Nature; Andrew Gelman)
“On the science and ethics of Ebola treatments”, “Controlled trials: the 194878ya watershed”
“Academic urban legends”, Rekdal 2014
“School Desegregation and Black Achievement: an integrative review”, Wortman & Bryant 1985
invoking spirits to control coin flips (p < 0.05): Bakan 1966
stereotype threat: “An Examination of Stereotype Threat Effects on Girls’ Mathematics Performance”, Ganley et al 201313ya; “The influence of gender stereotype threat on mathematics test scores of Dutch high school students: a registered report”, Flore et al 2019;“Stereotype Threat Effects in Settings With Features Likely Versus Unlikely in Operational Test Settings: A Meta-Analysis”, Shewach et al 2019
“In half of the [placebo-controlled] studies, the results provide evidence against continued use of the investigated surgical procedures.” (media)
“How to Make More Published Research True”, Ioannidis 2014
“Deliberate practice: Is that all it takes to become an expert?”, Hambrick et al 2014
“Whither the Blank Slate? A Report on the Reception of Evolutionary Biological Ideas among Sociological Theorists”, Horowitz et al 201412ya (media)
“Bayesian data analysis”, Kruschke 2010
“The harm done by tests of significance”, Hauer 200422ya (how p-values increase traffic fatalities)
“Suppressing Intelligence Research: Hurting Those We Intend to Help”, Gottfredson 2005
“Social Psychology as History”, Gergen 197353ya; “Political Diversity Will Improve Social Psychological Science”, Duarte et al 201511ya; “Implications of ideological bias in social psychology on clinical practice”, Silander et al 2020 (liberal ideological homogeneity in social sciences causing problems)
“Contradicted and Initially Stronger Effects in Highly Cited Clinical Research”, Ioannidis 2005
“Non-replicable publications are cited more than replicable ones”, Serra-Garcia & Gneezy 2021
“A ‘Sham Procedure’ Leads to Disappointing Multiple Sclerosis News”
“What Went Wrong? Reflections on Science by Observation and The Bell Curve”, Glymour 199828ya (correlation & causation)
“Effects of remote, retroactive intercessory prayer on outcomes in patients with bloodstream infection: randomized controlled trial”, Leibovici 200125ya (Norvig comments)
“Scholarly Context Not Found: One in Five Articles Suffers from Reference Rot”, Klein et al 2014
“Should Psychological Neuroscience Research Be Funded?” (discussion)
“Interpreting observational studies: why empirical calibration is needed to correct p-values”, Schuemie et al 2012
“Compliance with Results Reporting at ClinicalTrials.gov”, Anderson et al 201511ya (incentives matter)
“Estimating the reproducibility of psychological science”, Open Science Collaboration 2015
“Many Labs 3: Evaluating participant pool quality across the academic semester via replication” (commentary)
“p Values are not Error Probabilities”, Hubbard & Bayarri 2003
“Most Published Research Findings Are False—But a Little Replication Goes a Long Way”, Moonesinghe 2007
“Mice Fall Short as Test Subjects for Some of Humans’ Deadly Ills”
“Predictive modeling, data leakage, model evaluation” (a researcher is just a very big neural net model)
“The Nine Circles of Scientific Hell”, Neuroskeptic 2012
“The Economics of Reproducibility in Preclinical Research”, Freedman et al 2015
“An Alternative to Null-Hypothesis Significance Tests: Prep”, Killeen 2005
“Effect of monthly vitamin D3 supplementation in healthy adults on adverse effects of earthquakes: a randomized controlled trial”, Slow et al 201412ya (if only more people could be this imaginative in thinking about how to run RCTs, and less defeatist)
“Does ocean acidification alter fish behavior? Fraud allegations create a sea of doubt”
“How One Man Poisoned a City’s Water Supply (and Saved Millions of Children’s Lives in the Process)” (on John L. Leal & water chlorination)
“Reanalyses of Randomized Clinical Trial Data”, Ebrahim et al 2014
“The Null Ritual: What You Always Wanted to Know About Significance Testing but Were Afraid to Ask”, Gigerenzer et al 2004
“The Bayesian Reproducibility Project” (interpreting the psychology reproducibility projects’ results not by uninterpretable p-values but by a direct Bayesian examination of whether the replications support or contradict the originals); “Statistical Methods for Replicability Assessment”, Hung & Fithian 2019
“The Most Dangerous Equation” (sample size and standard error; examples: coinage, disease rates, small schools, male test scores.)
“When Quality Beats Quantity: Decision Theory, Drug Discovery, and the Reproducibility Crisis”, Scannell & Bosley 2016; “Artificial intelligence in drug discovery: what is realistic, what are illusions? Part 1: Ways to make an impact, and why we are not there yet: Quality is more important than speed and cost in drug discovery”, Bender & Cortés-Ciriano 2021
“Online Controlled Experiments: Introduction, Learnings, and Humbling Statistics”, Kohavi 2012
“Underreporting in Psychology Experiments: Evidence From a Study Registry”, Franco et al 201511ya (previously: Franco et al 2014)
“The Scientific Impact of Positive and Negative Phase 3 Cancer Clinical Trials”, Unger et al 2016
“The Stress Test: Rivalries, intrigue, and fraud in the world of stem-cell research”
“Correlation and Causation in the Study of Personality”, Lee 2012
-
“Is Bilingualism Really an Advantage?”; “The Bitter Fight Over the Benefits of Bilingualism”; “The Bilingual Advantage: Three Years Later—Where do things stand in this area of research?”
“The Relationship of Bilingualism Compared to Monolingualism to the Risk of Cognitive Decline or Dementia: A Systematic Review and Meta-Analysis”, Mukadam et al 2017
“Is bilingualism associated with enhanced executive functioning in adults? A meta-analytic review”, Lehtonen et al 2018
“No evidence for a bilingual executive function advantage in the ABCD study”, Dick et al 2018
“The Advantages of Bilingualism Debate”, Antoniou 2019
“Bilingualism Affords No General Cognitive Advantages: A Population Study of Executive Function in 11,000 People”, Nichols et al 2020
“Foreign language learning in older age does not improve memory or intelligence: Evidence from a randomized controlled study”, Berggren et al 2020
“The importance of ‘gold standard’ studies for consumers of research”
“The Production of Human Capital in Developed Countries: Evidence from 196 Randomized Field Experiments”, Fryer 2016
“Seven Pervasive Statistical Flaws in Cognitive Training Interventions”, Moreau et al 2016
“Could a neuroscientist understand a microprocessor?”, Jonas & Kording 2016 (amusing followup to “Can a biologist fix a radio?”, Lazebnik 200224ya)
“Statistically Controlling for Confounding Constructs Is Harder than You Think”, Westfall & Yarkoni 2016 (See also Stouffer 1936/Thorndike 1942/Kahneman 1965.)
“Preventing future offending of delinquents and offenders: what have we learned from experiments and meta-analyses?”, Mackenzie & Farrington 2015
“Why It Took Social Science Years to Correct a Simple Error About ‘Psychoticism’”
“Can Results-Free Review Reduce Publication Bias? The Results and Implications of a Pilot Study”, Findley et al 2016 (on result-blind peer review)
“Evolution is Not Relevant to Sex Differences in Humans Because I Want it That Way! Evidence for the Politicization of Human Evolutionary Psychology”, Geher & Gambacorta 2016
“Science Is Not Always ‘Self-Correcting’: Fact-Value Conflation and the Study of Intelligence”, Cofnas 201511ya (scientific endorsement of the Noble Lie)
“How Multiple Imputation Makes a Difference”, Lall 2016 (many political science results biased & driven by treatment of missing data)
“The Iron Law Of Evaluation And Other Metallic Rules”, Rossi 1987
“Probing the Improbable: Methodological Challenges for Risks with Low Probabilities and High Stakes”, Ord et al 2008
“Predicting Experimental Results: Who Knows What?”, DellaVigna & Pope 2016; “Evaluating the replicability of social science experiments in Nature and Science between 201016ya and 2015”, Camerer et al 2018; “Predicting replication outcomes in the Many Labs 2 study”, Forsell et al 2018; “Laypeople Can Predict Which Social-Science Studies Will Be Replicated Successfully”, Hoogeveen et al 2020
“Does Reading a Single Passage of Literary Fiction Really Improve Theory of Mind? An Attempt at Replication”, Panero et al 2016
“We Gave Four Good Pollsters the Same Raw Data. They Had Four Different Results” (random error vs systematic error)
“Close but no Nobel: the scientists who never won; Archives reveal the most-nominated researchers who missed out on a Nobel Prize” (Nobels have considerable measurement error)
“Stereotype (In)Accuracy in Perceptions of Groups and Individuals”, Jussim et al 2015
“The Statistical Crisis in Science: The Cult Of P”, Debrouwere 2016 (a readable overview of the problems with p-values/NHST)
“The Young Billionaire Behind the War on Bad Science” (John D. Arnold)
“Reconstruction of a Train Wreck: How Priming Research Went off the Rails”
“Reporting bias inflates the reputation of medical treatments: A comparison of outcomes in clinical trials and online product reviews”, de Barra 2017
“Willingness to Share Research Data Is Related to the Strength of the Evidence and the Quality of Reporting of Statistical Results”, Wicherts et al 2011
“Empirical assessment of published effect sizes and power in the recent cognitive neuroscience and psychology literature”, Szucs & Ioannidis 2017
“Meta-assessment of bias in science”, Fanelli et al 2017
“Working Memory Training Does Not Improve Performance on Measures of Intelligence or Other Measures of ‘Far Transfer’: Evidence From a Meta-Analytic Review”, Melby-Lervag et al 2016
“How readers understand causal and correlational expressions used in news headlines”, Adams et al 2017 (people do not understand the difference between correlation and causation)
“Proceeding From Observed Correlation to Causal Inference: The Use of Natural Experiments”, Rutter 2007
“Daryl Bem Proved ESP Is Real—which means science is broken” (Apparently Bem was serious. But one man’s modus ponens is another man’s modus tollens.)
“Does High Self-esteem Cause Better Performance, Interpersonal Success, Happiness, or Healthier Lifestyles?”, Baumeister et al 200323ya; “The Man Who Destroyed America’s Ego: How a rebel psychologist challenged one of the 20th century’s biggest—and most dangerous—ideas”; “‘It was quasi-religious’: the great self-esteem con”
“Computational Analysis of Lifespan Experiment Reproducibility”, Petrascheck & Miller 2017 (Power analysis of Gompertz curve mortality data: as expected, most animal studies of possible life-extension drugs are severely underpowered, which has the usual implications for replication, exaggerated effect sizes, & publication bias.)
“Discontinuation and Nonpublication of Randomized Clinical Trials Conducted in Children”, Pica et al 2016
“The prior can generally only be understood in the context of the likelihood”, Gelman et al 2017 (“They strain at the gnat of the prior who swallow the camel of the likelihood.”)
“The High Cost of Not Doing Experiments”, Nisbett 2015
“Very large treatment effects in randomized trials as an empirical marker to indicate whether subsequent trials are necessary: meta-epidemiological assessment”, Nagendran et al 2016
“On the Reproducibility of Psychological Science”, Johnson et al 2016
“Disappointing findings on Conditional Cash Transfers as a tool to break the poverty cycle in the United States” (results inflated by self-reported data; as the US is not Scandinavia, many studies depend on self-report.)
“No Beneficial Effects of Resveratrol on the Metabolic Syndrome: A Randomized Placebo-Controlled Clinical Trial”, Kjær et al 2017 (A big resveratrol null: zero effect, even evidence of harm.)
“‘Peer review’ is younger than you think. Does that mean it can go away?”; “Peer Review: The end of an error?”
“Randomized Controlled Trial of the Metropolitan Police Department Body-Worn Camera Program”/“A Big Test of Police Body Cameras Defies Expectations”
“‘Unbelievable’: Heart Stents Fail to Ease Chest Pain”, of Al-Lamee et al 2017
“When the music’s over. Does music skill transfer to children’s and young adolescents’ cognitive and academic skills? A Meta-Analysis”, Sala & Gobet 201
“Does Far Transfer Exist? Negative Evidence From Chess, Music, and Working Memory Training”, Sala & Gobet 2017
“Practice Does Not Make Perfect: No Causal Effect of Music Practice on Music Ability”, Mosing et al 2014
“Cognitive and academic benefits of music training with children: A multilevel meta-analysis”, Sala & Gobet 2020
“The World Might Be Better Off Without College for Everyone: Students don’t seem to be getting much out of higher education”; “Do High School Sports Build or Reveal Character?”, Ransom & Ransom 201
“The Elusive Backfire Effect: Mass Attitudes’ Steadfast Factual Adherence”, Wood & Porter 2017 (Big failed replication: n = 10100/k = 52.)
“The Minimal Persuasive Effects of Campaign Contact in General Elections: Evidence from 49 Field Experiments”, Kalla & Broockman 2017
“Randomizing Religion: The Impact of Protestant Evangelism on Economic Outcomes”, Bryan et al 2018 (How beneficial is religion to individuals?)
“Does teaching children how to play cognitively demanding games improve their educational attainment? Evidence from a Randomized Controlled Trial of chess instruction in England”, Jerrim et al 2017 (“no”)
“Evaluation of Evidence of Statistical Support and Corroboration of Subgroup Claims in Randomized Clinical Trials”, Wallach et al 2017 (Lies, damn lies, and subgroups.)
“Inventing the randomized double-blind trial: the Nuremberg salt test of 1835”, Stolberg 200620ya (The first double-blind randomized pre-registered clinical trial in history was a 1835191ya German test of homeopathic salt remedies.)
“Questioning the evidence on hookworm eradication in the American South”, Roodman 2017
“Homogenous: The Political Affiliations of Elite Liberal Arts College Faculty”, Langbert 2018
“Producing Wrong Data Without Doing Anything Obviously Wrong!”, Mytkowicz et al 2009
“Revisiting the Marshmallow Test: A Conceptual Replication Investigating Links Between Early Delay of Gratification and Later Outcomes”, Watts et al 2018 (effect size shrinks considerably in replication and the effect appears moderated largely through the expected individual traits like IQ)
“Two Cheers For Corporate Experimentation: The A/B Illusion And The Virtues Of Data-Driven Innovation”, Meyer 2015
“The Impostor Cell Line That Set Back Breast Cancer Research”
“Split brain: divided perception but undivided consciousness”, Pinto et al 2017
“p-Hacking and False Discovery in A/B Testing”, Berman et al 2018
“22 Case Studies Where Phase 2 and Phase 3 Trials had Divergent Results”, FDA 2017 (Small study biases)
“Effects of the Tennessee Prekindergarten Program on children’s achievement and behavior through third grade”, Lipsey et al 2018
“Plan to replicate 50 high-impact cancer papers shrinks to just 18”
“Researcher at the center of an epic fraud remains an enigma to those who exposed him”
“The prehistory of biology preprints: A forgotten experiment from the 1960s”, Cobb 2017 (Who killed preprints the first time? The commercial academic publishing cartel did. Copyright is why we can’t have nice things.)
“Replication Failures Highlight Biases in Ecology and Evolution Science”
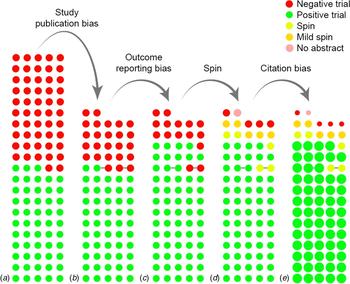
“The cumulative effect of reporting and citation biases on the apparent efficacy of treatments: the case of depression”, de Vries et al 2018 (Figure 1: the flowchart of bias)
“Evaluating replicability of laboratory experiments in economics”, Camerer et al 2016 (“About 40% of economics experiments fail replication survey”)
“Communicating uncertainty in official economic statistics”, Manski 201511ya (error from systematic bias > error from random sampling error in major economic statistics)
“Many Analysts, One Data Set: Making Transparent How Variations in Analytic Choices Affect Results”, Silberzahn et al 2018
“First analysis of ‘pre-registered’ studies shows sharp rise in null findings”
“The Meaningfulness of Effect Sizes in Psychological Research: Differences Between Sub-Disciplines and the Impact of Potential Biases”, Schäfer & Schwarz 2019
“Why do humans reason? Arguments for an argumentative theory”, Mercier & Sperber 2011
“How to play 20 questions with nature and lose: Reflections on 100 years of brain-training research”, Katz et al 2018
The state of ovulation evopsych research: mostly wrong, some right
“Many Labs 2: Investigating Variation in Replicability Across Sample and Setting”, Klein et al 2018 (28 targets, k = 60, n = 7000 each, Registered Reports: 14⁄28 replication rate w/few moderators/country differences & remarkably low heterogeneity); “Generalizability of heterogeneous treatment effect estimates across samples”, Coppock et al 2018; “Heterogeneity in direct replications in psychology and its association with effect size”, Olsson-Collentine 2020
“Many Labs 5: Testing Pre-Data-Collection Peer Review as an Intervention to Increase Replicability”, Ebersole et al 2020
“Empirical audit and review and an assessment of evidentiary value in research on the psychological consequences of scarcity”, O’Donnell et al 2021
“Comparing meta-analyses and preregistered multiple-laboratory replication projects”, Kvarven et al 2019
“A Star Surgeon Left a Trail of Dead Patients—and His Whistleblowers Were Punished” (organizational incentives & science)
“How Facebook and Twitter could be the next disruptive force in clinical trials”
“Five-Year Follow-up of Antibiotic Therapy for Uncomplicated Acute Appendicitis in the APPAC Randomized Clinical Trial”, Salminen et al 2018 (media; most appendicitis surgeries unnecessary—the question is never whether running an RCT is ethical, the question is how can not running it possibly be ethical?)
“Causal language and strength of inference in academic and media articles shared in social media (CLAIMS): A systematic review”, Haber et al 2018
“What’s Wrong with Psychology Anyway?”, Lykken 1991
“Notes on a New Philosophy of Empirical Science”, Burfoot 201115ya (the ‘compression as inference’ paradigm of intelligence for application to science; stupid gzip tricks, Cilibrasi 200620ya; stupid zpaq tricks with paqclass)
“The association between adolescent well-being and digital technology use”, Orben & Przybylski 2019 (SCA: brute-forcing the ‘garden of forking paths’ to examine robustness of results—the poor man’s Bayesian model comparison)
“Most Rigorous Large-Scale Educational RCTs are Uninformative: Should We Be Concerned?”, Lortie-Forgues & Inglis 2019
“How Replicable Are Links Between Personality Traits and Consequential Life Outcomes? The Life Outcomes of Personality Replication Project”, Soto 2019 (individual-differences research continues to replicate well)
“Beware the pitfalls of short-term program effects: They often fade”
“Behavior Genetic Research Methods: Testing Quasi-Causal Hypotheses Using Multivariate Twin Data”, Turkheimer & Harden 2014
“How genome-wide association studies (GWAS) made traditional candidate gene studies obsolete”, Duncan et al 2019 (apropos of SSC on Border et al 2019 revisiting the candidate-gene & gene-environment debacles)
“Objecting to experiments that compare two unobjectionable policies or treatments”, Meyer et al 2019
“The Hype Cycle of Working Memory Training”, Redick 2019
“Meta-Research: A comprehensive review of randomized clinical trials in three medical journals reveals 396 [13%] medical reversals”, Herrera-Perez et al 2019
“The Big Crunch”, David Goodstein 1994
“Super-centenarians and the oldest-old are concentrated into regions with no birth certificates and short lifespans”, Newman 2019 (“a primary role of fraud and error in generating remarkable human age records”)
“How Gullible are We? A Review of the Evidence from Psychology and Social Science”, Mercier 2017
“Registered reports: an early example and analysis”, Wiseman et al 2019 (parapsychology was the first field to use Registered Reports in 197650ya, which cut statistical-significance rates by 2⁄3rds: Johnson 197551yaa, Johnson 197551yab, Johnson 197611)
“Anthropology’s Science Wars: Insights from a New Survey”, Horowitz et al 2019 (visualizations)
“Effect of Lower Versus Higher Red Meat Intake on Cardiometabolic and Cancer Outcomes: A Systematic Review of Randomized Trials”, Zeraatkar et al 2019 (“diets lower in red meat may have little or no effect on all-cause mortality (HR 0.99 [95% CI, 0.95 to 1.03])”)
“Reading Lies: Nonverbal Communication and Deception”, Vrij et al 2019
“The small effects of political advertising are small regardless of context, message, sender, or receiver: Evidence from 59 real-time randomized experiments”, Coppock et al 2020
David Rosenhan’s Rosenhan experiment:
Did psychologist David Rosenhan fabricate his famous 197353ya “Being Sane in Insane Places” mental hospital exposé? (Andrew Scull/Lando 1976; Nature & Griggs et al 2020 review; on the Rosenhan experiment; interesting to consider Spitzer 1975’s criticisms in light of this)
“Orchestrating false beliefs about gender discrimination”: what did the famous ‘blind orchestra audition’ study show? (Gelman commentary)
“Debunking the Stanford Prison Experiment”, Le Texier 2019
“Crowdsourcing data analysis: Do soccer referees give more red cards to dark skin toned players?” (61 analysts examine the same dataset for the same research question to see how much variation in approach determines results); “Crowdsourcing Hypothesis Tests”, Landy et al 2019 (“200 Researchers, 5 Hypotheses, No Consistent Answers: Just how much wisdom is there in the scientific crowd?”)
“How a Publicity Blitz Created The Myth of Subliminal Advertising”, Rogers 1992
-
“‘We are not recommending you give to Texas per se’: GiveDirectly’s bold disaster-relief experiment”
“John Arnold Made a Fortune at Enron. Now He’s Declared War on Bad Science”
“Reproducibility Initiative receives $1.3M grant to validate 50 landmark cancer studies”
“The Four Most Dangerous Words? A New Study Shows”, Laura Arnold, 2017 TED talk
“Effect Declines Are Systematic, Strong, and Ubiquitous: A Meta-Meta-Analysis of the Decline Effect in Intelligence Research”, Pietschnig et al 2019
“Matthew Walker’s Why We Sleep Is Riddled with Scientific and Factual Errors”, Alexey Guzey
“The maddening saga of how an Alzheimer’s ‘cabal’ thwarted progress toward a cure for decades”
“A national experiment reveals where a growth mindset improves achievement”, Yeager et al 2019
“A Meta-Analysis of Procedures to Change Implicit Measures”, Forscher et al 2019; “Psychology’s Favorite Tool [the IAT] for Measuring Racism Isn’t Up to the Job: Almost two decades after its introduction, the implicit association test has failed to deliver on its lofty promises”; “The Implicit Association Test in Introductory Psychology Textbooks: Blind Spot for Controversy”, Bartels & Schoenrade 2021
“Rational Judges, Not Extraneous Factors In Decisions”; “Impossibly Hungry Judges”
“Compliance with legal requirement to report clinical trial results on ClinicalTrials.gov: a cohort study”, DeVito et al 2020; “FDA and NIH let clinical trial sponsors keep results secret and break the law”, Science
“The reproducibility of statistical results in psychological research: An investigation using unpublished raw data”, Artner et al 2020
“Producing Wrong Data Without Doing Anything Obviously Wrong!”, Mytkowicz et al 2009
“Likelihood of Null Effects of Large NHLBI Clinical Trials Has Increased over Time”, Kaplan & Ivin 2015
“On Attenuated Interactions, Measurement Error, and Statistical Power: Guidelines for Social and Personality Psychologists”, Blake & Gangestad 2020
“Variability in the analysis of a single neuroimaging dataset by many teams”, Botvinik-Nezer et al 2020
“Towards Reproducible Brain-Wide Association Studies”, Marek et al 2020
“Can Short Psychological Interventions Affect Educational Performance? Revisiting the Effect of Self–Affirmation Interventions”, Serra-Garcia et al 2020
“Do police killings of unarmed persons really have spillover effects? Reanalyzing Bor et al 2018”, Nix & Lozada 2019
“The statistical properties of RCTs and a proposal for shrinkage”, van Zwet et al 2020
“Off-target toxicity is a common mechanism of action of cancer drugs undergoing clinical trials”, Lin et al 2019
“Two Researchers Challenged a Scientific Study About Violent Video Games—and Took a Hit for Being Right”; “Research linking violent entertainment to aggression retracted after scrutiny”
“RCTs to Scale: Comprehensive Evidence from Two Nudge Units”, DellaVigna & Linos 2020
“Time to assume that health research is fraudulent until proven otherwise?”
“The Chrysalis Effect: How Ugly Initial Results Metamorphose Into Beautiful Articles”, O’Boyle et al 2014
“Putting the Self in Self-Correction: Findings From the Loss-of-Confidence Project”, Rohrer et al 2021
“No effect of ‘watching eyes’: An attempted replication and extension investigating individual differences”, Rotella et al 2021
“The Role of Human Fallibility in Psychological Research: A Survey of Mistakes in Data Management”, Kovacs et al 2021
“A pre-registered, multi-lab non-replication of the action-sentence compatibility effect (ACE)”, Morey et al 2021
“This scientist accused the supplement industry of fraud. Now, his own work is under fire”
Pygmalion Effect
Pygmalion In The Classroom: Teacher Expectation and Pupil’s Intellectual Development, Rosenthal & Jacobson 196858ya; Experimenter Effects in Behavioral Research, Rosenthal 1976
“Reviews: Rosenthal, Robert, and Jacobson, Lenore; Pygmalion in the Classroom. 1968”, Thorndike 196858ya; “But You Have To Know How To Tell Time”, Thorndike 1969
“Unfinished Pygmalion”, Snow 1969
Pygmalion Reconsidered: A Case Study In Statistical Inference: Reconsideration Of The Rosenthal-Jacobson Data On Teacher Expectancy, Elashoff & Snow 1971
“Five Decades Of Public Controversy Over Mental Testing”, Cronbach 1975
“The Self-Fulfillment of the Self-Fulfilling Prophecy: A Critical Appraisal”, Wineburg 198739yaa; “Does Research Count in the Lives of Behavioral Scientists?”, Wineburg 198739yab
“Pygmalion and Intelligence?”, Snow 1995
“Teacher Expectations and Self-Fulfilling Prophecies: Knowns and Unknowns, Resolved and Unresolved Controversies”, Jussim & Harber 2005
“We’ve Been Here Before: The Replication Crisis over the ‘Pygmalion Effect’”
Datamining
Some examples of how ‘datamining’ or ‘data dredging’ can manufacture correlations on demand from large datasets by comparing enough variables:
Rates of autism diagnoses in children correlate with age—or should we blame organic food sales?; height & vocabulary or foot size & math skills may correlate strongly (in children); national chocolate consumption correlates with Nobel prizes12, as do borrowing from commercial banks & buying luxury cars & serial-killers/mass-murderers/traffic-fatalities13; moderate alcohol consumption predicts increased lifespan and earnings; the role of storks in delivering babies may have been underestimated; children and people with high self-esteem have higher grades & lower crime rates etc., so “we all know in our gut that it’s true” that raising people’s self-esteem “empowers us to live responsibly and that inoculates us against the lures of crime, violence, substance abuse, teen pregnancy, child abuse, chronic welfare dependency and educational failure”—unless perhaps high self-esteem is caused by high grades & success, boosting self-esteem has no experimental benefits, and may backfire?
Those last can be generated ad nauseam: Shaun Gallagher’s Correlated (also a book) surveys users & compares against all previous surveys with 1k+ correlations.
Tyler Vigen’s “spurious correlations” catalogues 35k+ correlations, many with r > 0.9, based primarily on US Census & CDC data.
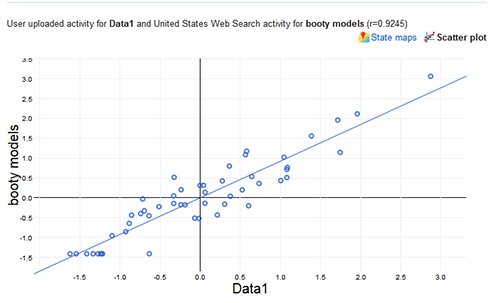
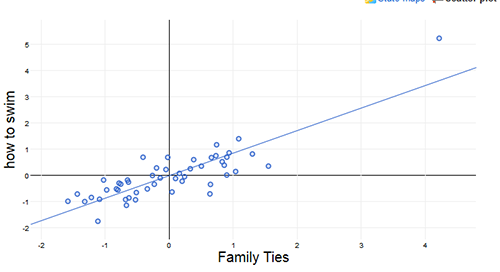
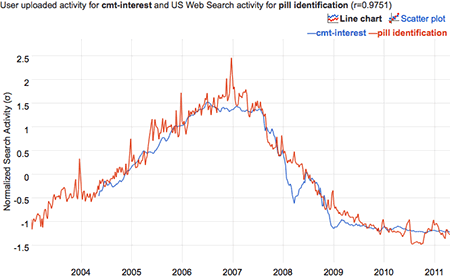
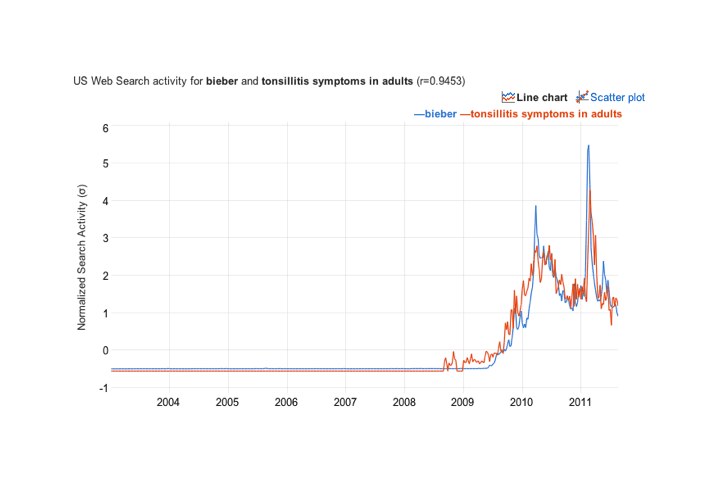
Google Correlate “finds Google search query patterns which correspond with real-world trends” based on geography or user-provided data, which offers endless fun (“Facebook”/“tapeworm in humans”, r = 0.8721; “Superfreakonomic”/“Windows 7 advisor”, r = 0.9751; Irish electricity prices/“Stanford webmail”, r = 0.83; “heart attack”/“pink lace dress”, r = 0.88; US states’ parasite loads/“booty models”, r = 0.92; US states’ family ties/“how to swim”; metronidazole/“Is Lil’ Wayne gay?”, r = 0.89; Clojure/“prnhub”, r = 0.9784; “accident”/“itchy bumps”, r = 0.87; “migraine headaches”/“sciences”, r = 0.77; “Irritable Bowel Syndrome”/“font download”, r = 0.94; interest-rate-index/“pill identification”, r = 0.98; “advertising”/“medical research”, r = 0.99; Barack Obama 201214ya vote-share/“Top Chef”, r = 0.88; “losing weight”/“houses for rent”, r = 0.97; “Bieber”/tonsillitis, r = 0.95; …
And on less secular themes, do churches cause obesity & do Welsh rugby victories predict papal deaths?
Financial data-mining offers some fun examples; there’s the Super Bowl/stock-market one which worked well for several decades; and it’s not very elegant, but a 3-variable model (Bangladeshi butter, American cheese, joint sheep population) reaches R2=0.99 on 20 years of the S&P 500
Animal Models
Publication bias can come in many forms, and seems to be severe. For example, the 200818ya version of a Cochrane review (“Full publication of results initially presented in abstracts (Review)”) finds “Only 63% of results from abstracts describing randomized or controlled clinical trials are published in full. ‘Positive’ results were more frequently published than not ‘positive’ results.”↩︎
For a second, shorter take on the implications of low prior probabilities & low power: “Is the Replicability Crisis Overblown? Three Arguments Examined”, Pashler & Harris 201214ya:
↩︎So what is the truth of the matter? To put it simply, adopting an alpha level of, say, 5% means that about 5% of the time when researchers test a null hypothesis that is true (ie. when they look for a difference that does not exist), they will end up with a statistically-significant difference (a Type 1 error or false positive.)1 Whereas some have argued that 5% would be too many mistakes to tolerate, it certainly would not constitute a flood of error. So what is the problem?
Unfortunately, the problem is that the alpha level does not provide even a rough estimate, much less a true upper bound, on the likelihood that any given positive finding appearing in a scientific literature will be erroneous. To estimate what the literature-wide false positive likelihood is, several additional values, which can only be guessed at, need to be specified. We begin by considering some highly simplified scenarios. Although artificial, these have enough plausibility to provide some eye-opening conclusions.
For the following example, let us suppose that 10% of the effects that researchers look for actually exist, which will be referred to here as the prior probability of an effect (ie. the null hypothesis is true 90% of the time). Given an alpha of 5%, Type 1 errors will occur in 4.5% of the studies performed (90% × 5%). If one assumes that studies all have a power of, say, 80% to detect those effects that do exist, correct rejections of the null hypothesis will occur in 8% of the time (80% × 10%). If one further imagines that all positive results are published then this would mean that the probability any given published positive result is erroneous would be equal to the proportion of false positives divided by the sum of the proportion of false positives plus the proportion of correct rejections. Given the proportions specified above, then, we see that more than one third of published positive findings would be false positives [4.5% / (4.5% + 8%) = 36%]. In this example, the errors occur at a rate approximately seven times the nominal alpha level (row 1 of Table 1).
Table 1 shows a few more hypothetical examples of how the frequency of false positives in the literature would depend upon the assumed probability of null hypothesis being false and the statistical power. An 80% power likely exceeds any realistic assumptions about psychology studies in general. For example, Bakker, van Dijk, and Wikkerts, (201214ya, this issue) estimate .35 as a typical power level in the psychological literature. If one modifies the previous example to assume a more plausible power level of 35%, the likelihood of positive results being false rises to 56% (second row of the table). John Ioannidis (200521yab) did pioneering work to analyze (much more carefully and realistically than we do here) the proportion of results that are likely to be false, and he concluded that it could very easily be a majority of all reported effects.
Table 1. Proportion of Positive Results That Are False Given Assumptions About Prior Probability of an Effect and Power.
Prior probability of effect
Power
Proportion of studies yielding true positives
Proportion of studies yielding false positives
Proportion of total positive results (false+positive) which are false
10%
80%
10% x 80% = 8%
(100–10%) x 5% = 4.5%
4.5% / (4.5% + 8%) = 36%
10%
35%
= 3.5%
= 4.5%
4.5% / (4.5% + 3.5%) = 56.25%
50%
35%
= 17.5%
(100–50%) x 5% = 2.5%
2.5% / (2.5% + 17.5%) = 12.5%
75%
35%
= 26.3%
(100–75%) x 5% = 1.6%
1.6% / (1.6% + 26.3%) = 5.73%
So for example, if we imagined that a Jaeggi effect size of 0.8 were completely borne out by a meta-analysis of many studies and turned in a point estimate of d = 0.8; this data would imply that the strength of the n-back effect was ~1 standard deviation above the average effect (of things which get studied enough to be meta-analyzable & have published meta-analyses etc.) or to put it another way, that n-back was stronger than ~84% of all reliable well-substantiated effects that psychology/education had discovered as of 199234ya.↩︎
We can infer empirical priors from field-wide collections of effect sizes, in particular, highly reliable meta-analytic effect sizes. For example, Lipsey & Wilson 199333ya which finds for various kinds of therapy a mean effect of d = 0.5 based on >300 meta-analyses; or better yet, “One Hundred Years of Social Psychology Quantitatively Described”, Bond et al 200323ya:
This article compiles results from a century of social psychological research, more than 25,000 studies of 8 million people. A large number of social psychological conclusions are listed alongside meta-analytic information about the magnitude and variability of the corresponding effects. References to 322 meta-analyses of social psychological phenomena are presented, as well as statistical effect-size summaries. Analyses reveal that social psychological effects typically yield a value of r equal to .21 and that, in the typical research literature, effects vary from study to study in ways that produce a standard deviation in r of .15. Uses, limitations, and implications of this large-scale compilation are noted.
Only 5% of the correlations were greater than .50; only 34% yielded an r of .30 or more; for example, Jaeggi 2008’s 15-day group racked up an IQ increase of d = 1.53 which converts to an r of 0.61 and is 2.6 standard deviations above the overall mean, implying that the DNB effect is greater than ~99% of previous known effects in psychology! (Schönbrodt & Perugini 2013 observe that their sampling simulation imply that, given Bond’s mean effect of r = .21, a psychology study would require n = 238 for reasonable accuracy in estimating effects; most studies are far smaller.)↩︎
One might be aware that the writer of that essay, Jonah Lehrer, was fired after making up materials for one of his books, and wonder if this work can be trusted; I believe it can as the New Yorker is famous for rigorous fact-checking (and no one has cast doubt on this article), Lehrer’s scandals involved his books, I have not found any questionable claims in the article besides Lehrer’s belief that known issues like publication bias are insufficient to explain the decline effect (which reasonable men may differ on), and Virginia Hughes ran the finished article against 7 people quoted in it like Ioannidis without any disputing facts/quotes & several somewhat praising it (see also Andrew Gelman).↩︎
If I am understanding this right, Jaynes’s point here is that the random error shrinks towards zero as N increases, but this error is added onto the “common systematic error” S, so the total error approaches S no matter how many observations you make and this can force the total error up as well as down (variability, in this case, actually being helpful for once). So for example, 1⁄3 + 1⧸√10 = 0.66; with N = 100, it’s 0.43; with N = 1,000,000 it’s 0.334; and with N = 1,000,000 it equals 0.333365 etc., and never going below the original systematic error of 1⁄3—that is, after 10 observations, the portion of error due to sampling error is less than that due to the systematic error, so one has hit severely diminishing returns in the value of any additional (biased) data, and to meaningfully improve the estimate one must obtain unbiased data. This leads to the unfortunate consequence that the likely error of N = 10 is 0.017<x < 0.64956 while for N = 1,000,000 it is the similar range 0.017<x < 0.33433—so it is possible that the estimate could be exactly as good (or bad) for the tiny sample as compared with the enormous sample, since neither can do better than 0.017!↩︎
Possibly this is what Lord Rutherford meant when he said, “If your experiment needs statistics you ought to have done a better experiment”.↩︎
Neglecting the finite-population correction, the standard deviation of the mean sampling error is and this quantity is largest when p = 0.5. The number of ballots returned was 2,376,523, and with a sample of this size the largest possible value of is , or 0.322 percentage point, so that an error of .2 percentage point is .2/.0322 = 6.17 times the standard deviation. The total area in the two tails of the Normal distribution below u = −6.17 and above u = +6.17 is .0000000007.↩︎
Over 10 million ballots were sent out. Of the 2,376,523 ballots which were filled in and returned, 1,293,669 were for Landon, 972,897 for Roosevelt, and the remainder for other candidates. The actual vote was 16,679,583 for Landon and 27,476,673 for Roosevelt out of a total of 45,647,117.↩︎
Readers curious about modern election forecasting’s systematic vs random error should see Shirani-Mehr et al 2018, “Disentangling Bias and Variance in Election Polls”: the systematic error turns out to be almost identical sized ie half the total error. Hence, anomalies like Donald Trump or Brexit are not particularly anomalous at all. –Editor.↩︎
Johnson, interestingly, like Bouchard, was influenced by Dunette 1966 (and also Wolins 1962).↩︎
I should mention this one is not quite as silly as it sounds as there is experimental evidence for cocoa improving cognitive function↩︎
The same authors offer up a number of country-level correlation such as “Linguistic Diversity/Traffic accidents”, alcohol consumption/morphological complexity, and acacia trees vs tonality, which feed into their paper “Constructing knowledge: nomothetic approaches to language evolution” on the dangers of naive approaches to cross-country comparisons due to the high intercorrelation of cultural traits. More sophisticated approaches might be better; they derive a fairly-plausible looking graph of the relationships between variables.↩︎