Potassium sleep experiments
2 self-experiments on potassium citrate effects on sleep: harm to sleep when taken daily or in the morning
Potassium and magnesium are minerals that many Americans are deficient in. I tried using potassium citrate and immediately noticed difficulty sleeping. A short randomized (but not blinded) self-experiment of ~4g potassium taken throughout the day confirmed large negative effects on my sleep. A longer followup randomized and blinded self-experiment used standardized doses taken once a day early in the morning, and also found some harm to sleep, and I discontinued potassium use entirely.
In October 201214ya, I bought some potassium citrate on a lark after noting that the daily RDA and my diet suggested that I was massively deficient. (I chose potassium citrate rather than potassium chloride because they are priced similarly and no information suggested they differed meaningfully, but I don’t really like the idea of chlorine, so I went with citrate.) The first night I slept terribly, taking what felt like hours to fall asleep and then waking up frequently—due to either the potassium or a fan left on; the second night with potassium, I turned off the fan but slept poorly again. My suspicions were aroused. I began recording sleep data.
Potassium Day Use
Background
Partway through the process, I searched Google Scholar and Pubmed (human trials) for “potassium sleep”; I checked the first 70 results of both. A general Google search turned up mostly speculation on the relationship of potassium deficiency and sleep. The only useful citation was “Potassium affects actigraph-identified sleep”, Drennan et al 199135ya; actigraphs likely aren’t as good as a Zeo, and n = 6, but the study is directly relevant. Only 2 actigraph results reached statistical-significance: a small improvement in sleep efficiency (the percentage of time spent laying in bed and actually sleeping) and a bigger benefit in “WASO” (time awake during sleep time; this probably drove the sleep efficiency).
Data
The first night (10/12) involved falling asleep in 30 minutes rather than my usual 19.6±11.9, waking up 12 times (5.9±3.4), and spending ~90 minutes awake (18.1±16.2) The next day (10/13) I took a similar dose and double-checked the fan before bed: 25 minutes to fall asleep, 10 awakenings, 35 minutes awake, but I woke fairly rested. So it seems like the fan was only partly to blame. The third day (10/14) I omitted any potassium: 21/8/29. Fourth (10/15) on again with an evening dose: 54/7/24. Fifth (10/16), off: 16/2/6. Sixth (10/17), on with a halved dose: 33/3/6. Seventh (10/18), off: 17/6/7. Eighth (10/20), half: 33/6/15.
At this point I began randomizing consumption between on and off; since this is preliminary, I didn’t bother with blinding potassium consumption. Ninth (10/21), on: 25/7/9. Tenth (10/22), on: 18/8/10. 11th (10/23), off: 26/4/10. 12th (10/24), off: 33/7/16. 13th (10/25), on: 32/7/13. 14th (10/26), on: 21/5/8. 15th, on: 34/2/1. 16th, off: 16/7/15. 17th, on: 29/8/20. 18th, on: 17/10/17. 19th, off: 36/9/24. 20th (11/1), on: 21/4/19. 21st (11/2), off: 29/7/16. 22nd (11/3), on: 26/7/10. 23rd (11/4), on: 16/4/11. 24th (11/5), off: 21/4/17. 25th (11/6), on: 19/9/24.
11 Nov, on: 15/3/08. 13 Nov, off: 11/8/21. 14 Nov, off: 18/8/22. 15 Nov, on: 30/8/16. 16 Nov, off: 20/7/12. 17 Nov, on: 34/8/20. 18 Nov, on: 12/8/22. 19 Nov, off: 24/8/14. 20 Nov, on: 26/4/39. 21 Nov, off: 15/6/14. 22 Nov, on: 26/8/29. 23 Nov, on: 23/4/8. 24 Nov, off: 24/3/5. 25 Nov, on: 27/7/15. 26 Nov, on: 30/10/17. 27 Nov, off: 42/12/13. 28 Nov, off: 40/11/42. 29 Nov, off: 19/14/50. 30 Nov, off: 32/8/39. (Here I counted the sample-sizes and realized the off days were drastically under-represented, reducing statistical power; so I have eliminated randomization and gone off potassium.) 1 Dec, off: 28/10/15. 2 Dec, off: 37/8/20. 3 Dec, off: 36/6/18. 4 Dec, off: 19/9/33. 5 Dec, off: 25/8/27. 6 Dec, off: 30/13/45. (Now balanced, resuming randomization.) 7 Dec, on: 31/9/60. 8 Dec, off: 22/9/23. 9 Dec, off: 11/5/21. 10 Dec, on: 30/4/10. 11 Dec, on: 22/9/50. 13 Dec, off: 20/5/6. 14 Dec, off: 33/13/25. 15 Dec, on: 26/11/22. 16 Dec, off: 33/12/28. 17 Dec, off: 42/9/31. 18 Dec, off: 31/9/61. 19 Dec, on: 23/8/18.
Analysis
Sleep Disturbances
If potassium was disturbing my sleep, I didn’t necessarily want to wait for any one metric of wakefulness to reach significance; rather, I wanted to combine them into a single metric of sleep problems: time to fall asleep (latency), number of awakenings, and time spent awake. (With all 3, higher is worse.) Number of awakenings tends to vary over a smaller range than time to fall asleep or time spent awake—a normal value for the former might be 5, rather than 30 for the latter; to compensate for that, we convert each metric into a standard deviation indicating how unusual eg. 10 awakenings is and whether it is more unusual than it taking 15 minutes to fall asleep. Then we can do a standard test. To graph the data at each step, starting with graphing all the data on an overlapping chart1 (this is not per day):
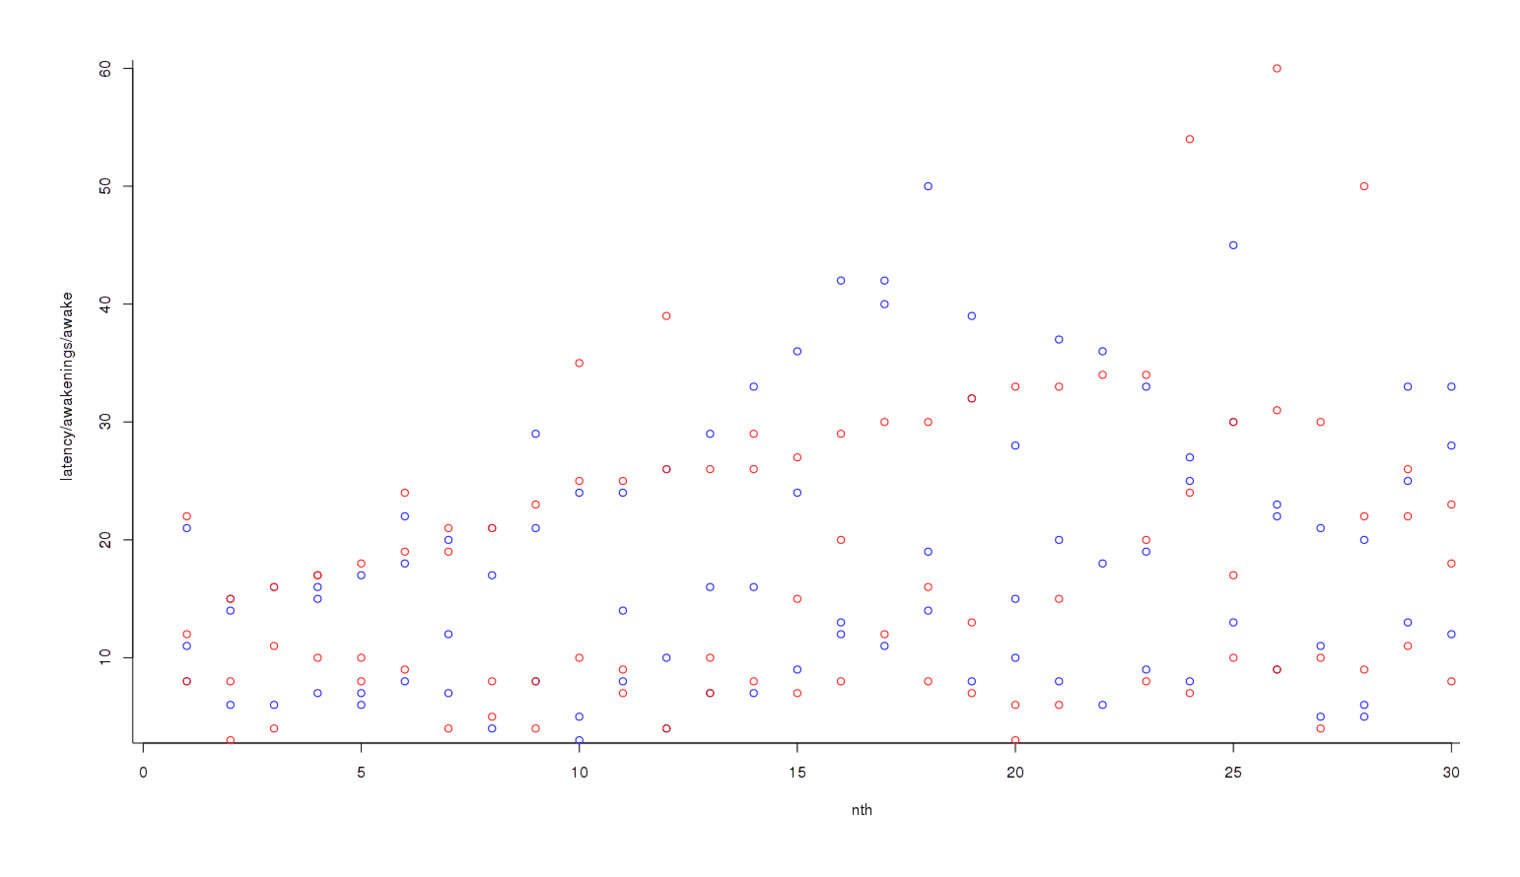
Plotting raw data of on and off-potassium nights, in a loosely chronological order
Nights off potassium are colored blue and nights on potassium are red; it looks like red dots are higher than blues, overall, but the trend is not clear. So we convert each individual datapoint to its respective standard deviation2:
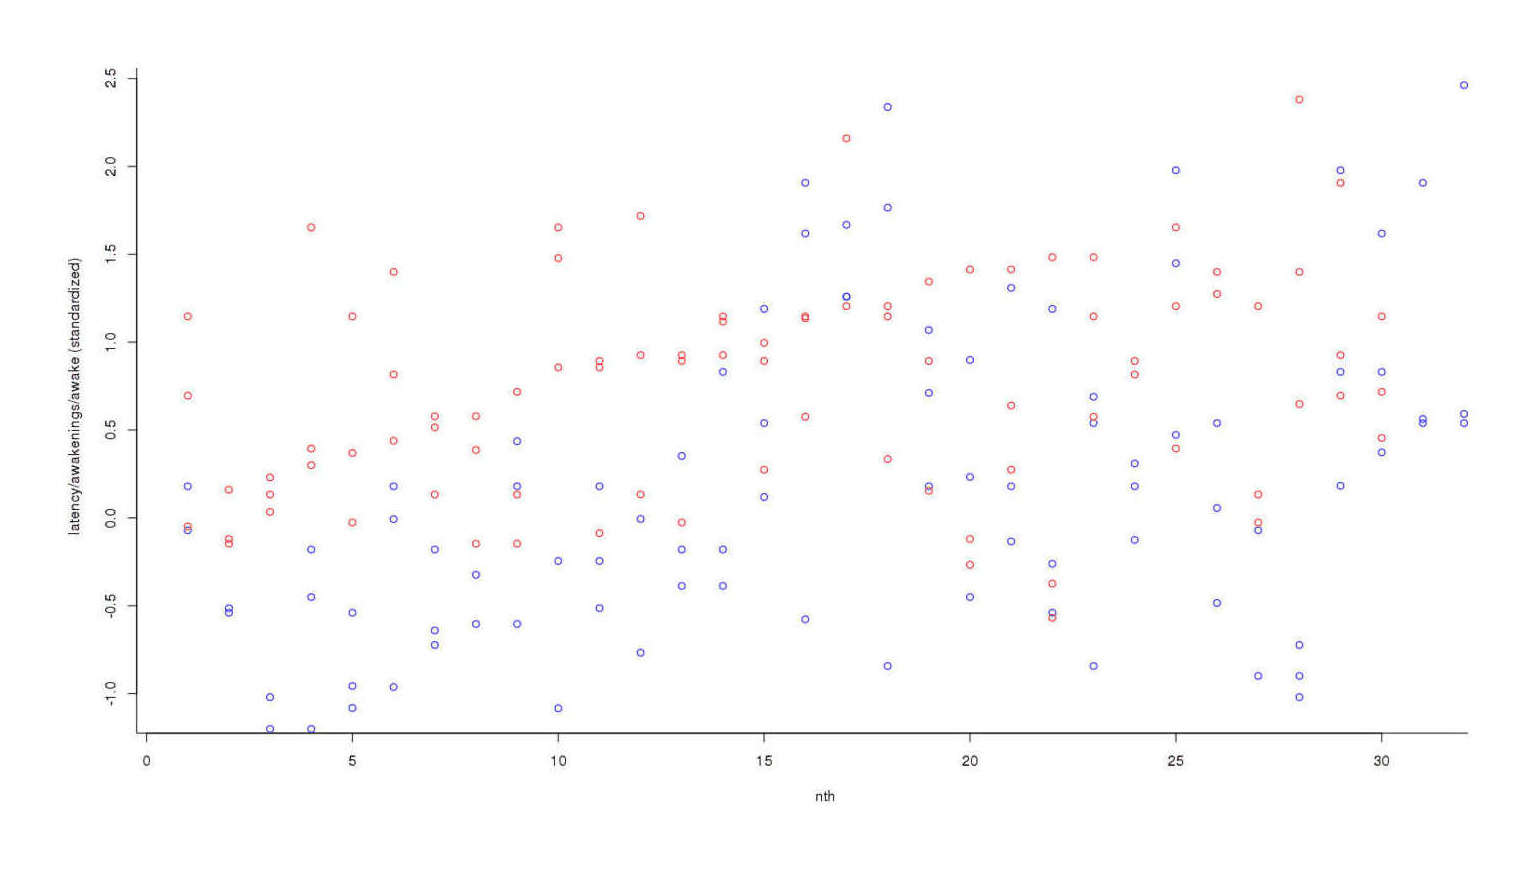
Plotting data of on and off-potassium nights, standardized into standard deviations
The trend has become much clearer, but the final step is to add each day’s scores to get an overall measure3:
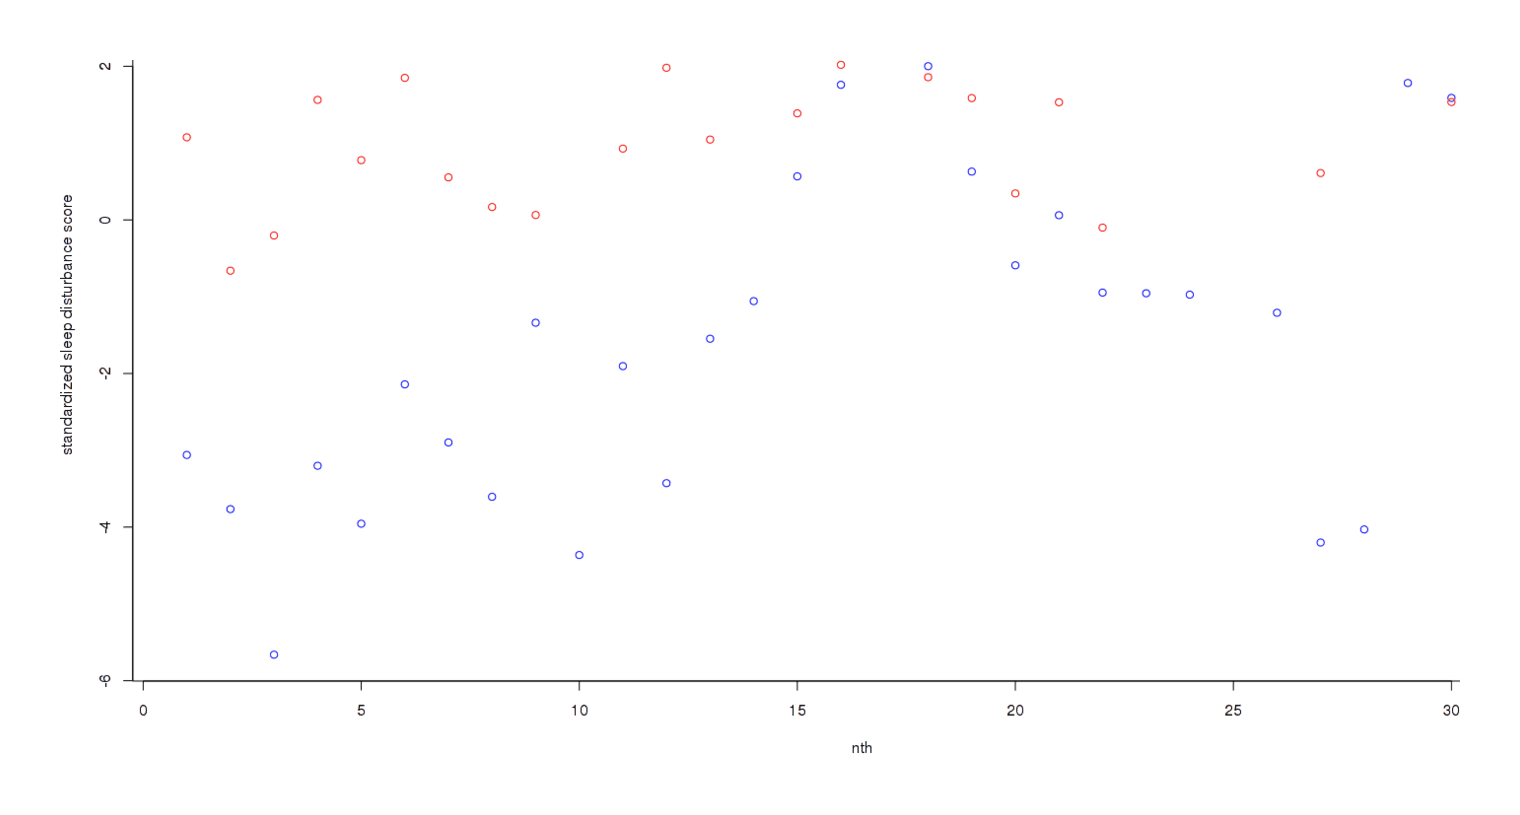
Final score per night
Now the different has become dramatic: one can almost draw a line separating both groups without any errors. As one would expect given this graphical evidence, a Bayesian two-group test reports that there is ~0 chance that the true effect size is 0, and the most likely effect size is a dismaying d = −1.14:
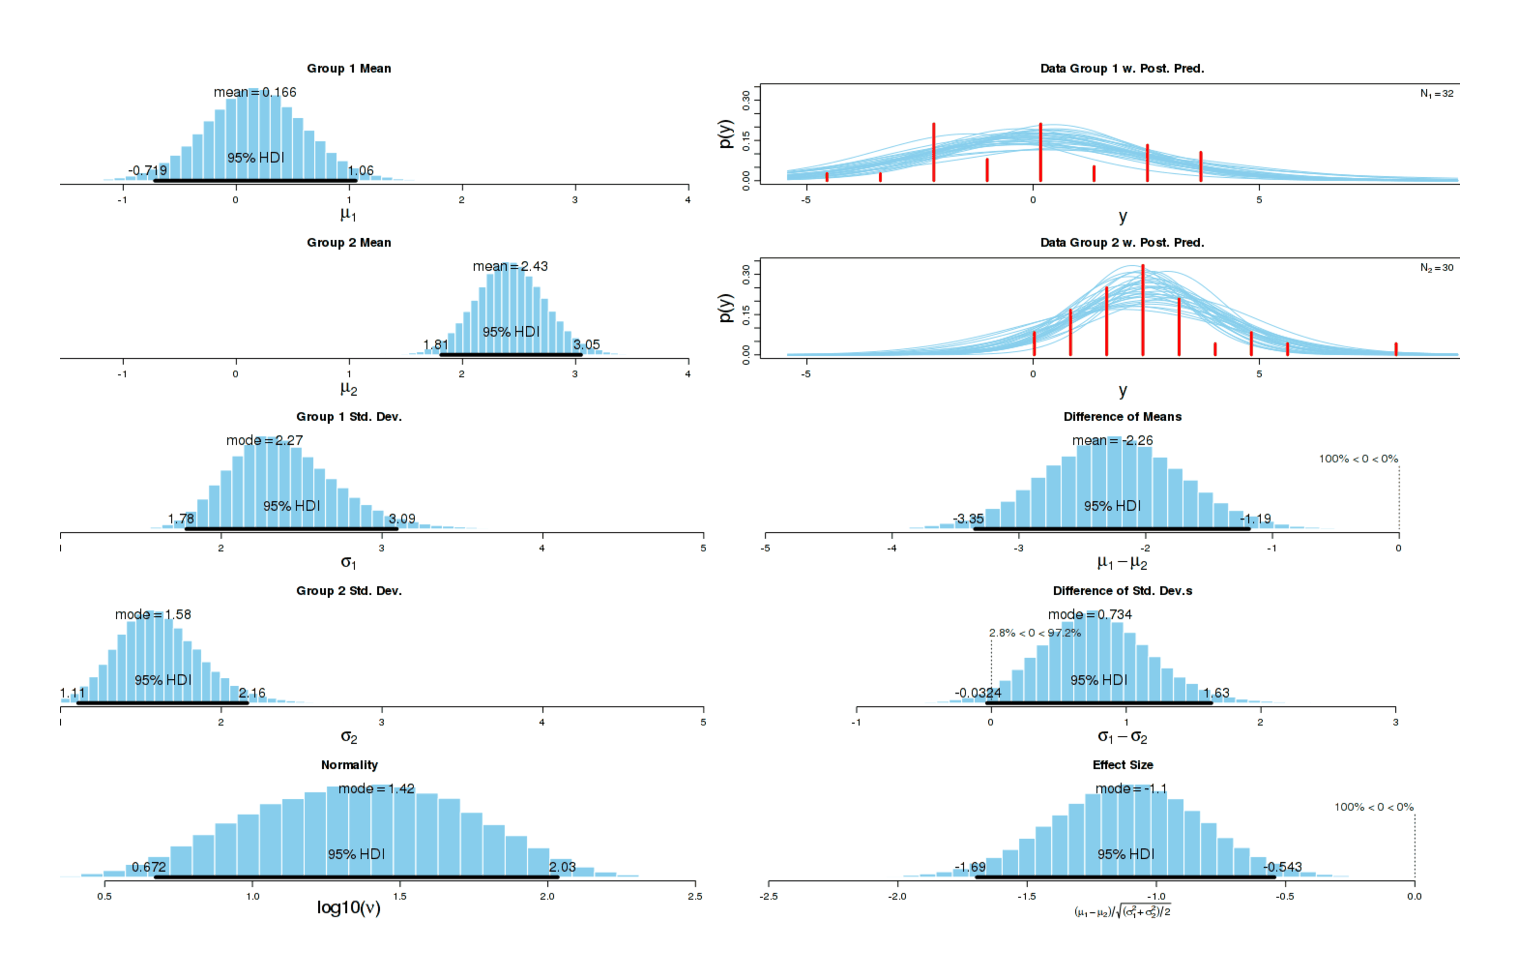
Comparison of sleep disturbances in nights on and off potassium citrate
A two-sample test agrees:5 p = 0.0002168. (There is no need for multiple correction in this instance.) This confirms my subjective impression.
Mood/productivity
A secondary question is whether potassium delivered any waking benefits. I write down at the end of each day my rating 2–4 how happy and/or productive I felt that day. Does this self-rating show any effect? Here’s a plot of each day colored by whether it was a potassium day:
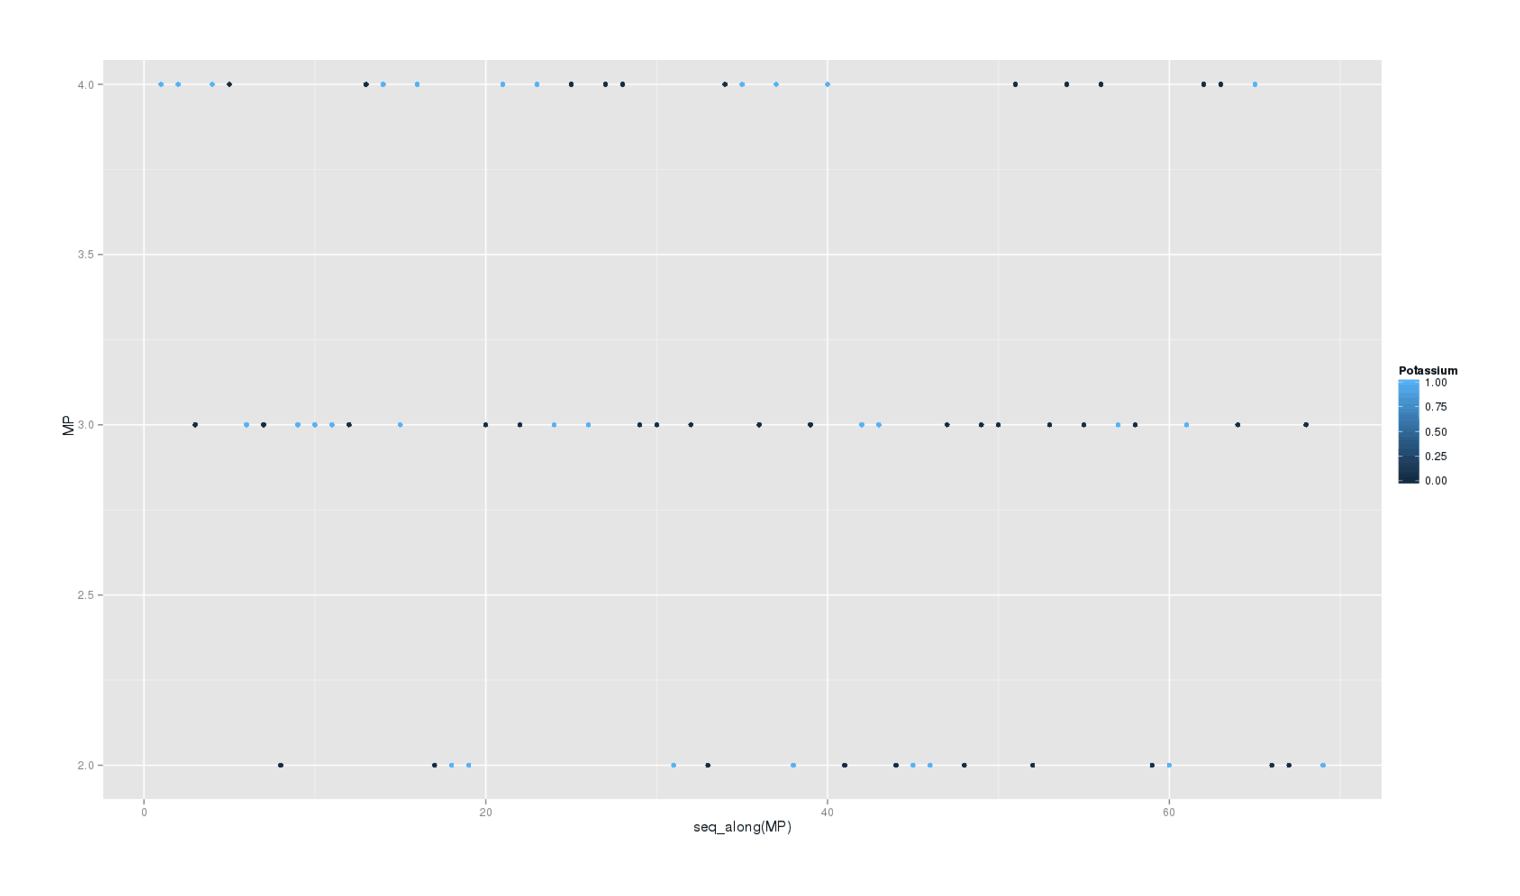
library(ggplot2); qplot(data=pot, y=MP, color=Potassium)
There is little visible effect, and the formal Bayesian6 analysis is as weak as the sleep disturbances are strong:
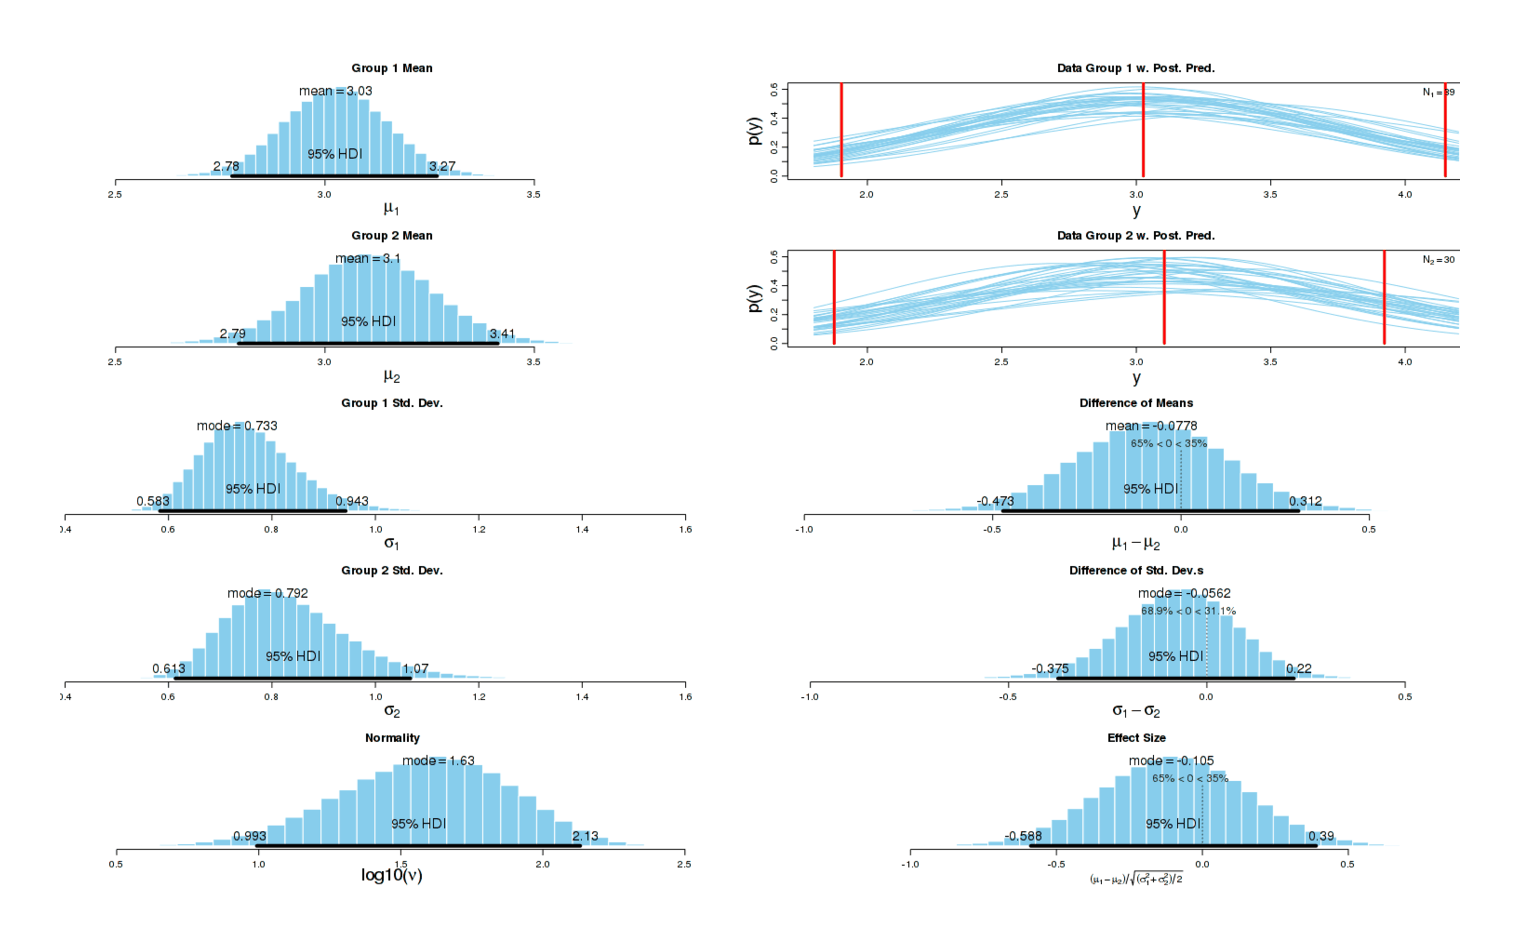
postInfo = BESTplot(off, on, mcmcChain)
So there is no apparent benefit from the potassium.
Conclusion
This experiment was hastily done and has several weaknesses, some I mentioned before; in ascending order of importance:
Non-Uniform Dosage:
Number of dosages varied from day to day as was convenient and doses were measured approximately with a spoon (since 4 grams is a pretty substantial amount, after all). Here is another objection I don’t think matters: lower than average doses may contribute to an underestimate of the effect size… but that implies that the effect size is even more extreme than −1.1! We are interested in problems that would shrink the effect size back to 0, not imply that it’s even worse than −1.1.
Incomplete Randomization:
As covered in the data section, there was a severe imbalance in sample size for each condition, so I stopped randomization for about a week. Intuitively, I don’t think there was anything special about that week in regard to getting very good sleep (as would be necessary to contribute to an overestimated effect size), but if anyone disagreed, it would not be hard to exclude those days and use the rest.
No Blinding:
I am not sure how much this matters. I had no expectation that potassium would affect my sleep at all, one user specifically denied any effect, the only study suggested I’d find improvements, I did not want to find a negative effect much less such a severe effect, and the sheer strength of the effect over a multi-month period is a bit more than I would expect from any expectancy or placebo effect.
Non-Uniform Timing:
Of the issues, this is the most important. If potassium has some stimulating effects as anecdotes claim, then timing may be causing all the sleep disturbances and not potassium per se. It might be exactly like vitamin D in this respect: taken in the evening, it badly damages sleep but taken in the morning, it does nothing or it improves sleep.
If I were to do a followup experiment, it would be blinded & randomized as usual, with consistent doses (eliminating objections 1–3), but more importantly, the dose would be consumed upon awakening.
I am not sure I will bother with a followup experiment. Potassium is not of particular interest to me, my existing supply is low after months of consumption, I observed no subjective improvements on consumption, and so I am not inclined to run the risk of damaging more months of sleep. Other people can do that.
Potassium Morning Use
As it happened, I managed to retrieve my pill-making machine and spare gel capsules, and I do hate to waste perfectly good potassium citrate powder, so I decided to do a morning experiment. I made 3×24 potassium pills and 3×24 brown rice pills (out of flour); I take one set of 3 pills each morning, randomly picking. This procedure addresses all 4 issues, and will answer the question about whether potassium’s sleep disturbance is due to a timing issue like that of caffeine and vitamin D. Analysis will be the same as before: 3 metrics of sleep disturbance, and then daily self-rating. (I didn’t devise a paired-blocks setup since my marked containers were in use elsewhere; as often happens I ran out of one set of pills first, the rice placebo pills, on 2013-02-10, and made another batch of 24 rice placebo pills. The last potassium pill was 2013-02-21.)
Analysis
Subjectively, I noticed nothing on what turned out to be the potassium days, unlike in the first experiment.
Sleep Disturbances
Running the analysis the same way as before, we get a small increase in sleep disturbances (d = 0.15, higher is worse) but the effect could easily be nothing7:
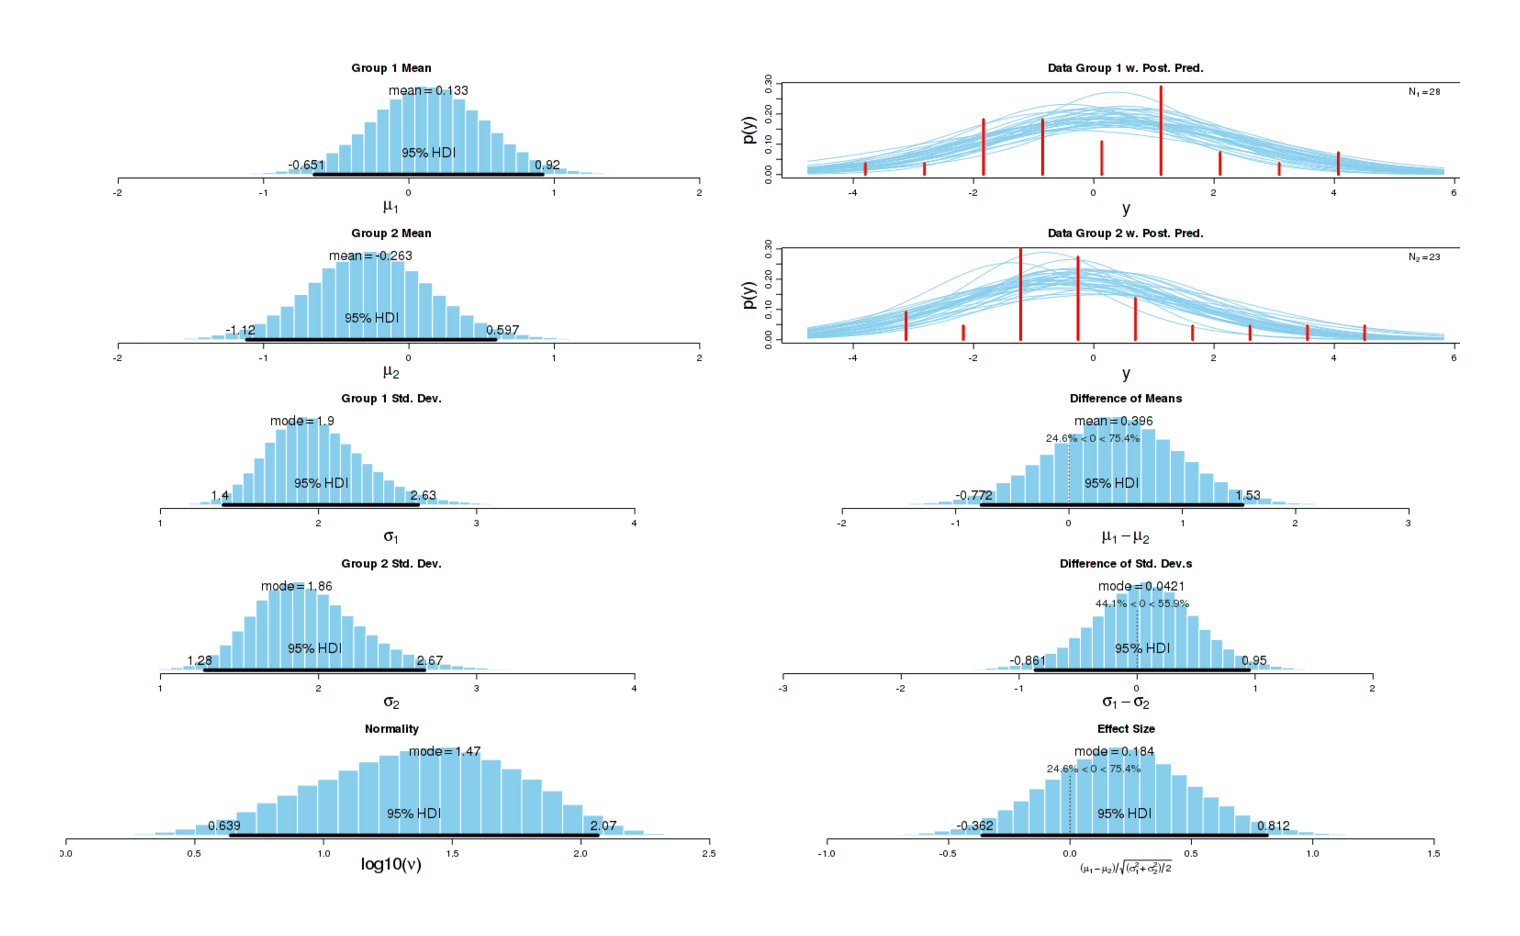
Potassium morning experiment, sleep problems
I suspect there really is an underlying causal effect: the first experiment indicated a large increase in sleep disturbances, and a much smaller one is in line with my expectations of the effect of a smaller standardized dose first thing upon waking.
But practically speaking, this small disturbance would be acceptable if it came with some benefit.
Mood/productivity
The results look almost identical to before8:
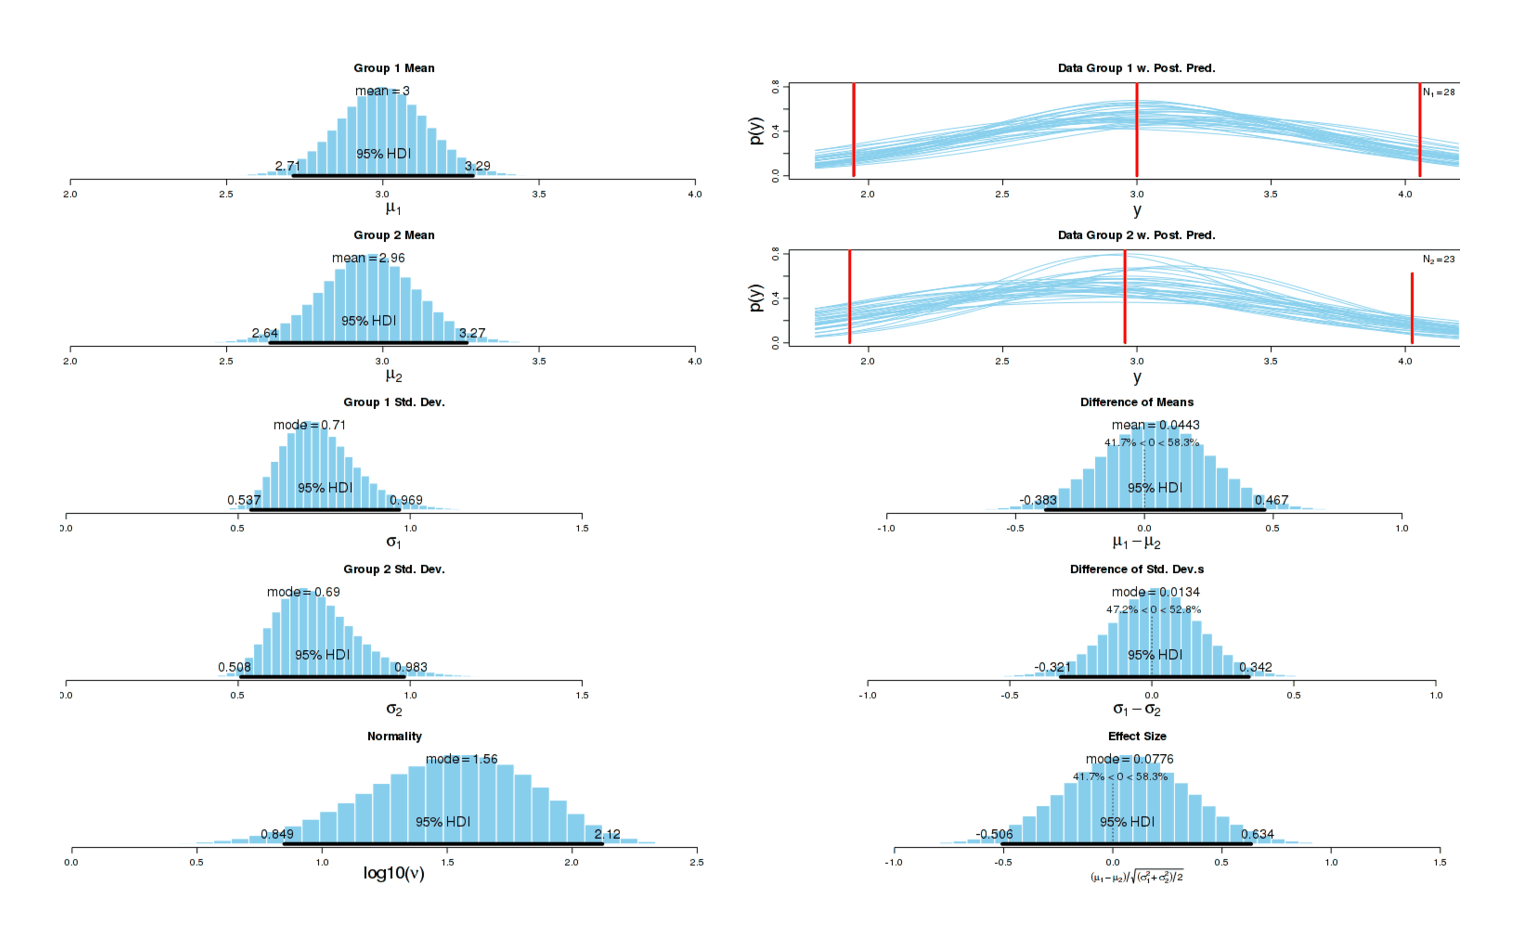
Potassium morning experiment, MP effect
Conclusion
A much higher-quality experiment with more favorable conditions for potassium showed a result consistent with some harm to my sleep, and no benefit. Since potassium showed harm in both circumstances with no suggestion of benefit, I will not continue using potassium.
External Links
The generating R code (see later analysis footnote for definitions of data variables like
offtimeawakeetc.):↩︎plot(c(1:32), offtimeawake, col="blue", xlab="nth", ylab="latency/awakenings/awake (raw)") points(c(1:32), offlatency, col="blue") points(c(1:32), offawakenings, col="blue") points(c(1:30), ontimeawake, col="red") points(c(1:30), onlatency, col="red") points(c(1:30), onawakenings, col="red")After running
zscoreon each data variable, we repeat the previous code but withylab="latency/awakenings/awake (standardized)"in the call toplot.↩︎Assuming the
zscoreconversion has been done:↩︎plot(c(1:32), offtimeawake+offlatency+offawakenings, col="blue", xlab="nth", ylab="standardized sleep disturbance score") points(c(1:30), ontimeawake+onlatency+onawakenings, col="red")The previously described composite measure and BEST test:
↩︎# for interventions with dates, see https://gwern.net/doc/zeo/2012-2013-potassium.csv # all the non-potassium days offlatency <- c(11,15,16,16,17,18,20,21,21,24,24,26,29,33,36,42,40,19,32,28,37,36,19,25, 30,22,11,20,33,33,42,31) offawakenings <- c(8,6,2,7,6,8,7,4,8,3,8,4,7,7,9,12,11,14,8,10,8,6,9,8,13,9,5,5,13,12,9,9) offtimeawake <- c(21,14,6,15,7,22,12,17,29,5,14,10,16,16,24,13,42,50,39,15,20,18,33,27,45, 23,21,6,25,28,31,61) # all the potassium days onlatency <- c(12,15,16,17,18,19,21,21,23,25,25,26,26,26,27,29,30,30,32,33,33,34,34, 54,30,31,30,22,26,23) onawakenings <- c(8,3,4,10,8,9,4,5,4,10,7,4,7,8,7,8,12,8,7,3,6,2,8,7,10,9,4,9,11,8) ontimeawake <- c(22,08,11,17,10,24,19,8,8,35,9,39,10,29,15,20,90,16,13,6,15,1,20,24, 17,60,10,50,22,18) # normalize zscore <- function(x,y) mapply(function(a) (a - mean(y))/sd(y), x) offlatency <- zscore(offlatency, c(offlatency, onlatency)) onlatency <- zscore(onlatency, c(offlatency, onlatency)) offawakenings <- zscore(offawakenings, c(offawakenings, onawakenings)) onawakenings <- zscore(onawakenings, c(offawakenings, onawakenings)) offtimeawake <- zscore(offtimeawake, c(offtimeawake, ontimeawake)) ontimeawake <- zscore(ontimeawake, c(offtimeawake, ontimeawake)) # zip together with sum to get a single measure of how deviate a night was off <- offlatency + offawakenings + offtimeawake on <- onlatency + onawakenings + ontimeawake # usual Bayesian two-group test source("BEST.R") mcmcChain = BESTmcmc(off, on) postInfo = BESTplot(off, on, mcmcChain) # graph postInfo # SUMMARY.INFO # PARAMETER mean median mode HDIlow HDIhigh pcgtZero # mu1 0.1664 0.1655 0.1421 -0.71894 1.0555 NA # mu2 2.4256 2.4210 2.4035 1.81175 3.0478 NA # muDiff -2.2592 -2.2592 -2.2318 -3.34666 -1.1853 0.006 # sigma1 2.3939 2.3607 2.2695 1.78291 3.0915 NA # sigma2 1.6189 1.5988 1.5786 1.11009 2.1614 NA # sigmaDiff 0.7750 0.7606 0.7341 -0.03236 1.6317 97.205 # nu 32.0045 23.2730 9.6599 2.33645 88.0997 NA # nuLog10 1.3607 1.3669 1.4214 0.67234 2.0337 NA # effSz -1.1141 -1.1107 -1.0959 -1.69481 -0.5433 0.006Reusing the standardized data from before:
↩︎wilcox.test(off, on) # Wilcoxon rank sum test # # data: off and on # W = 224, p-value = 0.0002168As before, we use BEST (the self-rating is mostly normal):
↩︎Potassium <- c(1,1,0,1,0,1,0,0,1,1,1,0,0,1,1,1,0,1,1,0,1,0,1,1,0,1,0,0,0,0,1,0,0,0,1,0,1,1, 0,1,0,1,1,0,1,1,0,0,0,0,0,0,0,0,0,0,1,0,0,1,1,0,0,0,1,0,0,0,1) MP <- c(4,4,3,4,4,3,3,2,3,3,3,3,4,4,3,4,2,2,2,3,4,3,4,3,4,3,4,4,3,3,2,3,2,4,4,3,4,2,3,4,2, 3,3,2,2,2,3,2,3,3,4,2,3,4,3,4,3,3,2,2,3,4,4,3,4,2,2,3,2) pot <- data.frame(Potassium, MP) # first graph: library(ggplot2) qplot(data=pot, y=MP, color=Potassium) # analysis: source("BEST.R") off <- pot$MP[pot$Potassium == 0] on <- pot$MP[pot$Potassium == 1] mcmcChain = BESTmcmc(off, on) postInfo = BESTplot(off, on, mcmcChain) # graph postInfo # SUMMARY.INFO # PARAMETER mean median mode HDIlow HDIhigh pcgtZero # mu1 3.02651 3.02686 3.03576 2.7780 3.2677 NA # mu2 3.10432 3.10390 3.07921 2.7939 3.4127 NA # muDiff -0.07782 -0.07736 -0.07786 -0.4728 0.3119 34.96 # sigma1 0.75685 0.74855 0.73261 0.5834 0.9427 NA # sigma2 0.83168 0.81845 0.79169 0.6133 1.0677 NA # sigmaDiff -0.07483 -0.07033 -0.05617 -0.3755 0.2195 31.15 # nu 47.52944 39.43237 23.78338 4.6350 111.4156 NA # nuLog10 1.58217 1.59585 1.63348 0.9931 2.1316 NA # effSz -0.09844 -0.09761 -0.10476 -0.5879 0.3897 34.96 wilcox.test(off, on) # Wilcoxon rank sum test with continuity correction # # data: off and on # W = 552.5, p-value = 0.6789See previously for explanation:
↩︎pot <- read.csv("https://gwern.net/doc/zeo/2013-gwern-potassium-morning.csv") # standardize & combine into a single equally-weighted synthetic index z-score pot$Disturbance <- scale(pot$Time.to.Z) + scale(pot$Awakenings) + scale(pot$Time.in.Wake) on <- pot[pot$Potassium==1,]$Disturbance off <- pot[pot$Potassium==0,]$Disturbance source("BEST.R") mcmcChain = BESTmcmc(off, on) postInfo = BESTplot(off, on, mcmcChain) # graph postInfo # SUMMARY.INFO # PARAMETER mean median mode HDIlow HDIhigh pcgtZero # mu1 0.1329 0.13224 0.11468 -0.6505 0.9203 NA # mu2 -0.2626 -0.26479 -0.22430 -1.1154 0.5966 NA # muDiff 0.3956 0.39838 0.37996 -0.7724 1.5327 75.39 # sigma1 1.9961 1.96663 1.89699 1.3978 2.6302 NA # sigma2 1.9403 1.90682 1.86314 1.2797 2.6697 NA # sigmaDiff 0.0558 0.06166 0.04212 -0.8615 0.9499 55.85 # nu 33.0593 24.28680 9.49415 1.7036 90.8230 NA # nuLog10 1.3674 1.38537 1.47058 0.6392 2.0655 NA # effSz 0.2054 0.20334 0.18368 -0.3619 0.8119 75.39on/offdefined and BEST loaded in previous analysis:↩︎mcmcChain = BESTmcmc(off$MP, on$MP) postInfo = BESTplot(off$MP, on$MP, mcmcChain) # graph postInfo # SUMMARY.INFO # PARAMETER mean median mode HDIlow HDIhigh pcgtZero # mu1 2.999866 2.99993 2.99749 2.7134 3.2884 NA # mu2 2.955535 2.95571 2.95990 2.6391 3.2689 NA # muDiff 0.044331 0.04465 0.05384 -0.3831 0.4669 58.29 # sigma1 0.739736 0.72787 0.71017 0.5371 0.9685 NA # sigma2 0.731523 0.71670 0.68979 0.5081 0.9827 NA # sigmaDiff 0.008212 0.01087 0.01340 -0.3210 0.3419 52.76 # nu 41.545632 33.20153 18.29201 2.5717 103.6089 NA # nuLog10 1.502165 1.52116 1.55933 0.8486 2.1209 NA # effSz 0.060755 0.06100 0.07764 -0.5064 0.6339 58.29